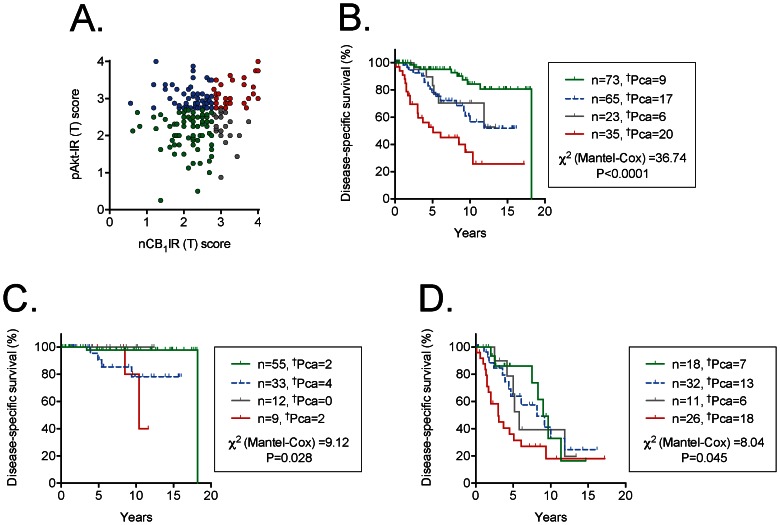
Figure 3. Scatter plots and Kaplan-Meier plots for the cases who were followed by expectancy and who had been scored for both nCB1IR and pAkt-IR.
Panel A shows a scatter plot of the individual cases, so that the group names in the other Panels are easier to follow. In the Kaplan-Meier plots shown in Panels B to D, †Pca refers to the number of patients who died as a result of their prostate cancer during the follow-up period. The  2 values are for the log-rank (Mantel-Cox) tests, with the P values shown. Panel B, all cases; Panel C, Gleason score 4–6 cases; Panel D, Gleason score 7–10 cases.

