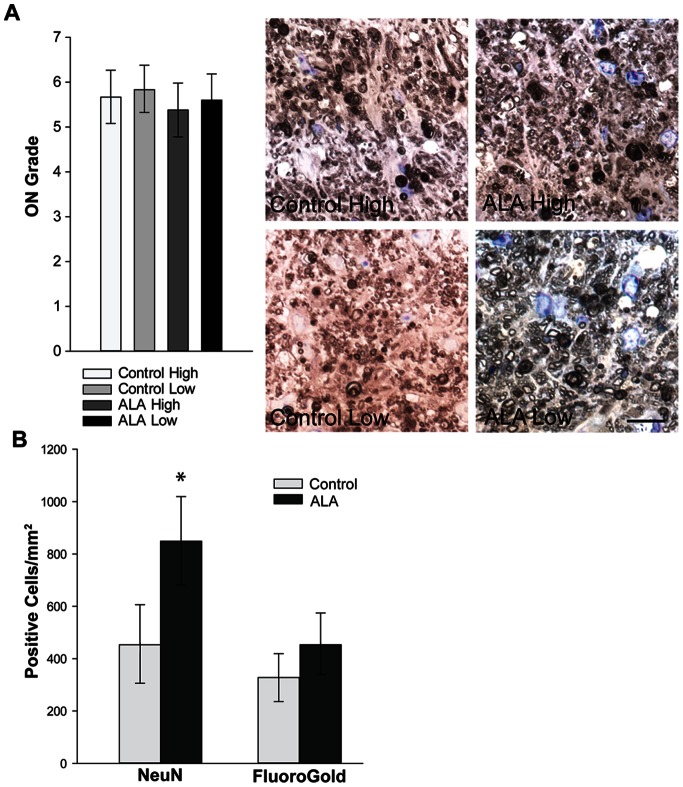
Figure 10. Axon degeneration and RGC number in 12-month DBA mice fed dietary ALA from weaning (prevention experiment).
A. Optic nerves from mice in the prevention experiment were graded for level of degeneration; 0 on the scale is no degeneration; 10 is 100% degeneration (see Methods). Though average level of degeneration is lower in the ALA treatment groups regardless of IOP, there is no significant difference in ON grade among groups (t-test, p = 0.31; n = 33 per group). The example optic nerve sections shown here, stained for p-phenylenediamine, are all grade 7, or 70 percent degenerated. Scale bar = 10 µm. B. Retinas analyzed for NeuN+ and FluoroGold+ cells in the GCL and corrected for displaced amacrine cells (see Methods) show significantly higher density of NeuN+ cells in the ALA treated retinas (*p = 0.02); FG+ cells in ALA treated retinas were not statistically different from control (p = 0.13) (n = 19 for the ALA group; n = 17 for the control group). The number of NeuN-positive cells in control retinas was 9028.1 ± 2975.2 compared to 17044.2 ± 3352.7 in ALA treated retinas (p<0.018). The number of FG-positive cells in control retinas was 5831.4 ± 1679.2 compared to 9091.5 ± 2125.4 in ALA treated retinas (p = 0.11).

