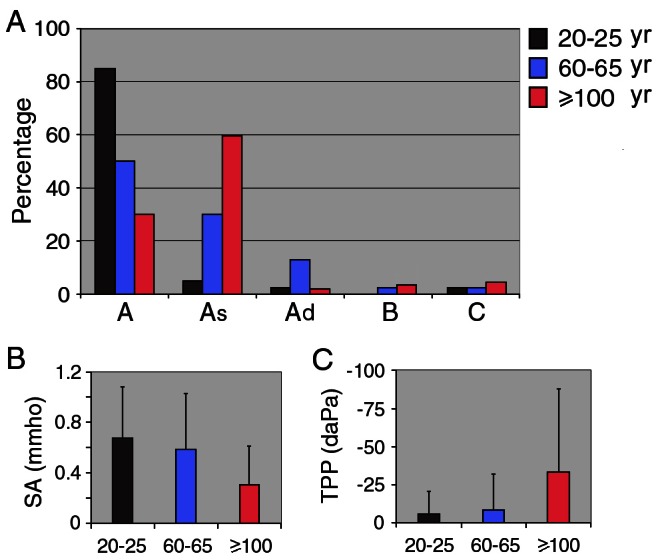
Figure 3. Parameters obtained from tympanometry.

A: Ratio (presented in percentage) of 5 different types (A, As, Ad, B, C) of tympanogram at different age groups. B: Peak compliance (mean ± SD) for the three groups are: 0.31±0.30 (≥100 years old), 0.58±0.44 (60–65 years old), and 0.67±0.41 (20–25 years old) mmho, respectively. Peak compliance of the centenarian group is significantly less than the other two groups. C: Middle ear pressure (mean ± SD) for the three groups are: −33.2±54 (≥100 years old), −8.2±24 (60–65 years old), and −5.5±15 (20–25 years old) daPa, respectively.
