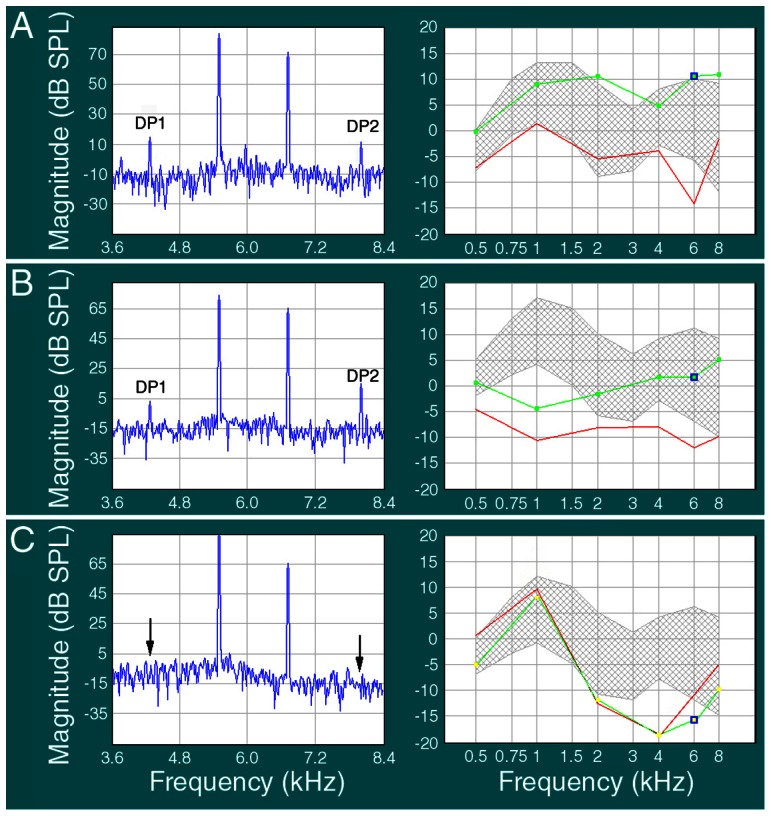
Figure 7. Representative DPOAE responses obtained from listeners from different age groups.

A: An example of DPOAE response obtained from a subject from the 20- to 25-year-old group. The two probe tones were set at frequencies close to 6,000 Hz. Distortion product one (DP1) and DP2 were clearly visible (∼10 dB above the noise level). The right panel shows the DPOAEs were detected in all test frequencies (500, 1,000, 2,000, 4,000, 6,000, and 8,000 Hz). B: An example of DPOAE obtained from a participant from the 60- to 65-year-old group. DPOAEs were also detected in all test frequencies. C: Otoacoustic emission from a centenarian subject using the same probe frequencies used in younger groups. DP1 and DP2 were absent (arrows indicate where DP1 and DP2 were expected in the frequency spectrum). The right panel shows that DPOAEs were not detected in all frequencies tested.
