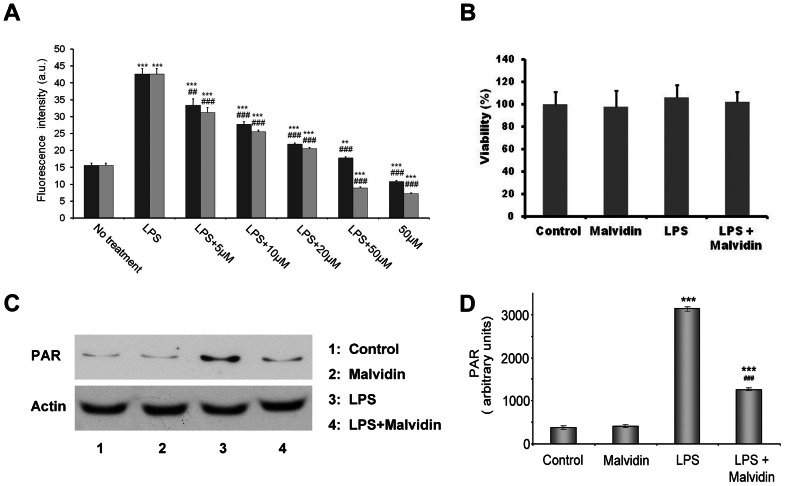
Figure 4. Effect of malvidin on LPS induced ROS production and PARP activation in RAW 264.7 macrophages.
Steady state ROS concentration in the culturing medium (A) and viability of the cells (B) was determined using the fluorescent redox dye C-400 and by the MTT method, respectively after incubating the cells for 24 h in the absence and presence of LPS together with 0–50 µM malvidin (black bars in A) or trans-resveratrol (gray bars in A) as indicated. Experiments running in 6 parallels were repeated 3 times. PARP activation was assessed by determining the steady state level of PAR using immunoblotting from whole cell lysate after treating the cells for 1h as indicated. Actin was used as loading control. Representative blots (C) and densitometric evaluations (D) of three independent experiments are shown. Pixel densities were normalized to that of the actin. Values are given as means ± SEM. ** p<0.01 *** p<0.001 compared to untreated control, ## p<0.01, ### p<0.001 compared to LPS alone. a.u.: arbitrary units.

