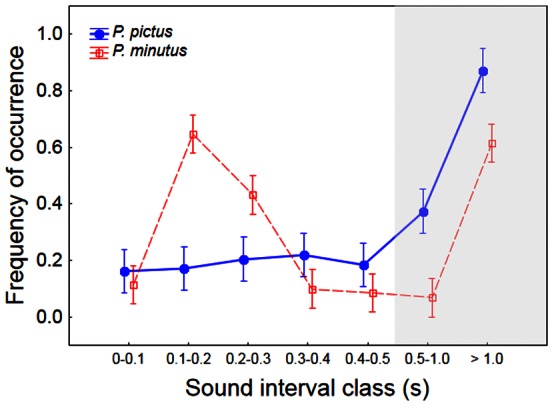
Figure 3. Frequency of occurrence of time intervals between consecutive drums in P. minutus and P. pictus.

Drum intervals were square root arcsin-transformed. Note that in the shaded area broader interval classes than the ones represented on the left area of the graph are shown. Symbols show means and error bars depict 95% confidence intervals.
