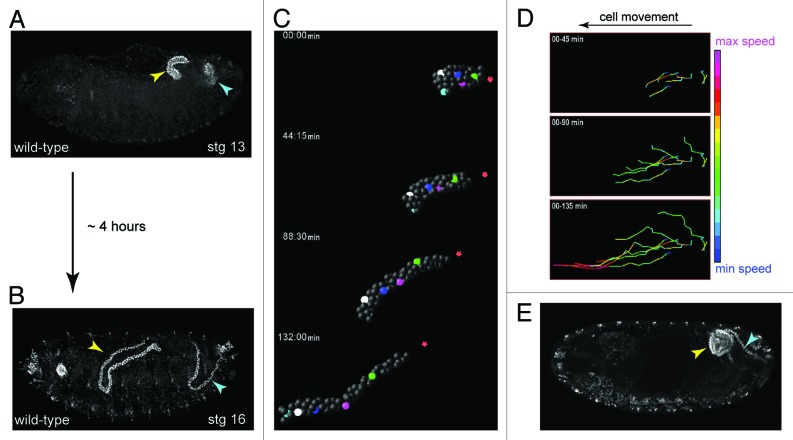
Figure 4. Shaping of the Malpighian tubule (A and B), During a period of about four hours MpTs undergo a dramatic change in shape that is driven by orderly cell intercalation, transforming from short, stubby tubules in mid-embryogenesis stage 13, (A) to long, elongated tubules in late embryogenesis stage 16 (B). (C) SIMI-Biocell assisted 3-D reconstruction of the distal portion of an anterior MpT. Five cells are marked in different colors and their positions tracked in XYZ over time. The distal-most tip cell is marked with red star. Such tracking can be used to quantify individual cell behaviors during tubule elongation (D). (D) Quantification of cell speed during intercalation. Cell speeds for the 5 cells marked in C are shown. The lines show cell tracks and color indicates cell speed. Net direction of cell movement is indicated by the arrow. (E) Orderly cell intercalation fails in crossveinless-c mutants. Anterior and posterior MpTs are indicated by yellow and cyan arrowheads in A, B and E. Images in C and D courtesy of Aditya Saxena.

An official website of the United States government
Here's how you know
Official websites use .gov
A
.gov website belongs to an official
government organization in the United States.
Secure .gov websites use HTTPS
A lock (
) or https:// means you've safely
connected to the .gov website. Share sensitive
information only on official, secure websites.
