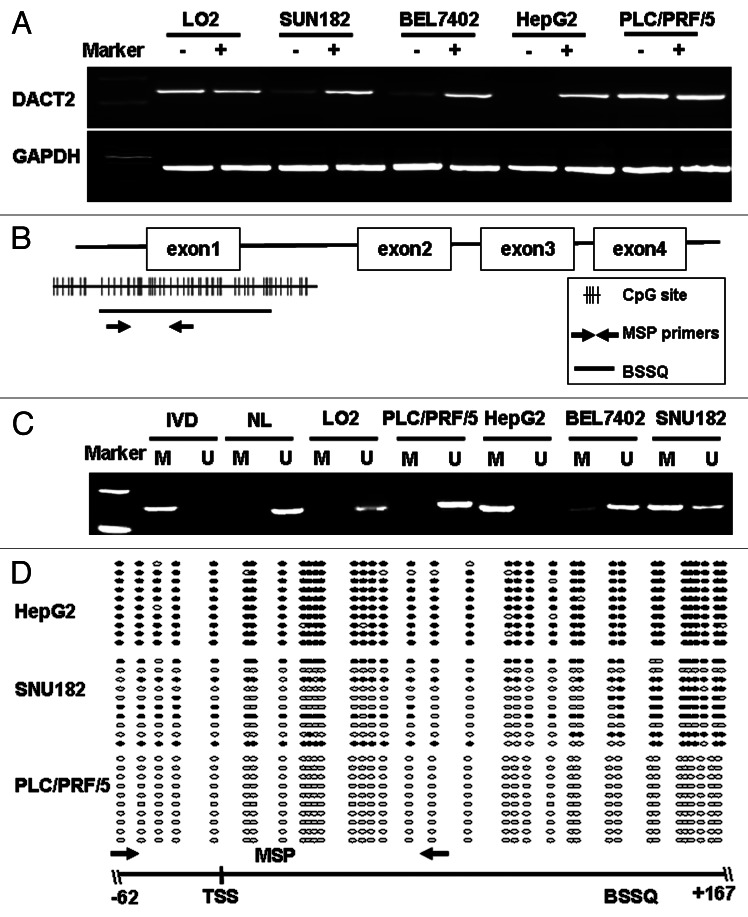
Figure 1.DACT2 is silenced by promoter region hypermethylation in HCC cell lines.(A) Expression of DACT2 was analyzed by semiquantitative RT-PCR in HCC cell lines and one immortalized hepatocyte cell line (LO2). (-) 5-AZA untreated; (+) 5-AZA treated; GAPDH was used as an internal control for RT-PCR. (B) Distribution of CpG sites in the promoter region of DACT2 and the location of the MSP primers as well as BSSQ region are shown. (C) DACT2 methylation was determined by MSP in HCC cell lines and LO2. IVD, in vitro methylated DNA (methylation control); NL, normal blood lymphocyte DNA (unmethylated control); M, methylated band; U, unmethylated band. (D) Promoter region methylation status of DACT2 was analyzed by BSSQ in three HCC cell lines. Open circles denote unmethylated CpG site and filled circles represented methylated CpG site. The region amplified by MSP is indicated by arrows. TSS, transcription start site.

An official website of the United States government
Here's how you know
Official websites use .gov
A
.gov website belongs to an official
government organization in the United States.
Secure .gov websites use HTTPS
A lock (
) or https:// means you've safely
connected to the .gov website. Share sensitive
information only on official, secure websites.
