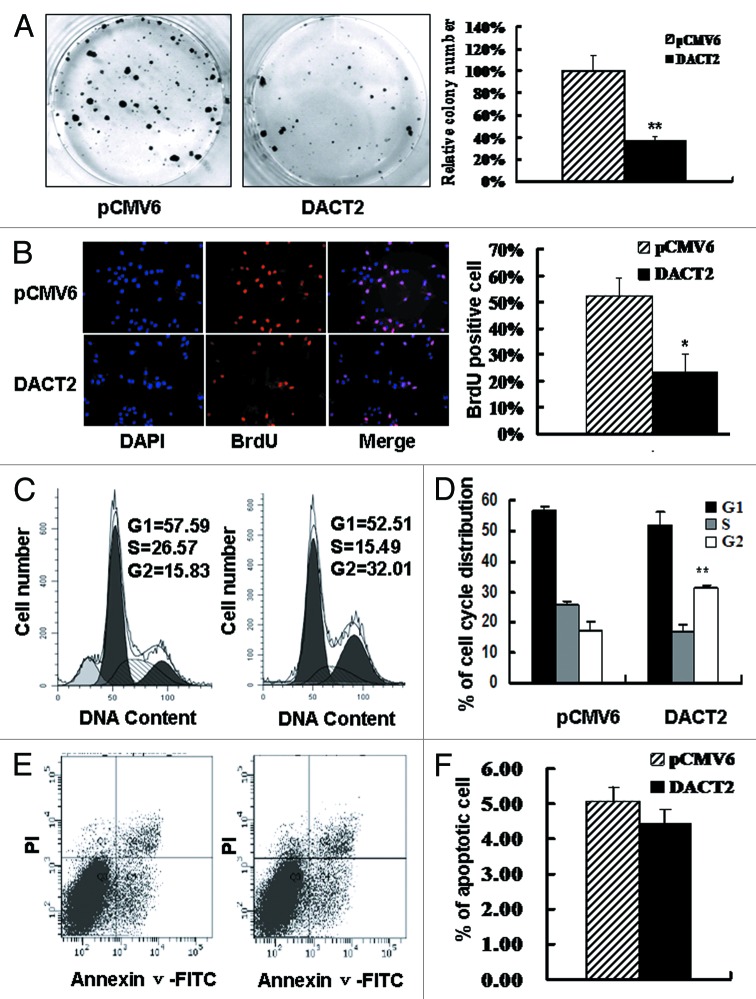
Figure 3. The effect of DACT2 on cell proliferation, cell cycle and apoptosis in vitro. (A) The effect of DACT2 on HCC cell proliferation was evaluated by colony formation assay. Left panel: Colony formation results of transfected with pCMV6 (empty vector) or DACT2 expression vector in HepG2 cells. Right panel: Quantitative analysis of colony numbers in different group. **p < 0.01. (B) BrdU incorporation was analyzed in pCMV6 or DACT2 expression vector transfected HepG2 cells. Left panel: cell nuclei were counterstained by BrdU and DAPI. Right panel: quantitative analysis of BrdU positive cells in different group. *p < 0.05. (C) Representative results of cell cycle distribution for pCMV6 (left panel) or DACT2 expression vector (right panel) transfected in HepG2 cells. Cycle distributions were measured by propidium iodide (PI) staining followed by flow cytometry after transfection for 48 h. (D) Quantitative analysis of cell cycle distribution in DACT2 expression and control group. **p < 0.01. (E) No effect was found on apoptosis after expression of DACT2 in HepG2 cell line. HepG2 cells were transfected with pCMV6 (left panel) or DACT2 expression vector (Right panel). 48 h serum starvation was performed 24 h after transfection. Then Annexin V-FITC/PI double staining was performed. Annexin V-positive and PI-negative staining cells are indicated as apoptotic cells. (F) Quantitative analysis of cell apoptosis.

An official website of the United States government
Here's how you know
Official websites use .gov
A
.gov website belongs to an official
government organization in the United States.
Secure .gov websites use HTTPS
A lock (
) or https:// means you've safely
connected to the .gov website. Share sensitive
information only on official, secure websites.
