
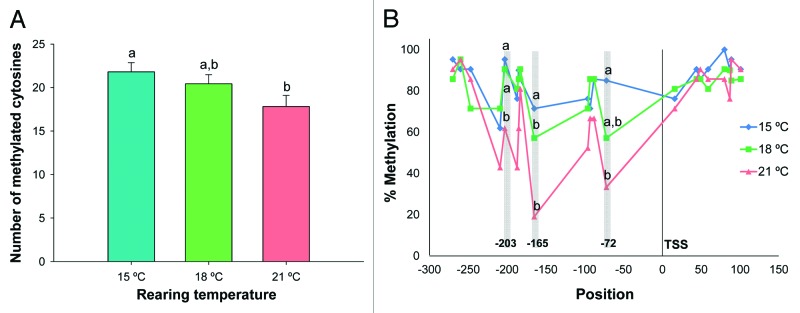
Figure 2. (A) Total number of methylated cytosines in the Senegalese sole myog proximal promoter in muscle of larvae reared at 15, 18 and 21°C. Error bars indicate the standard error of the means for each treatment (n = 21). Different letters (and no common letters) indicate statistically significant differences between temperatures (p < 0.05) as determined by ANOVA. (B) Percentage of cytosine methylation at 21 CpG sites in Senegalese sole myog proximal promoter in muscle of larvae reared at different temperatures (15, 18 and 21°C). Different letters indicate significant differences between temperatures at each CpG position (p < 0.05), as determined by AMOVA. TSS represents the transcription starting site.