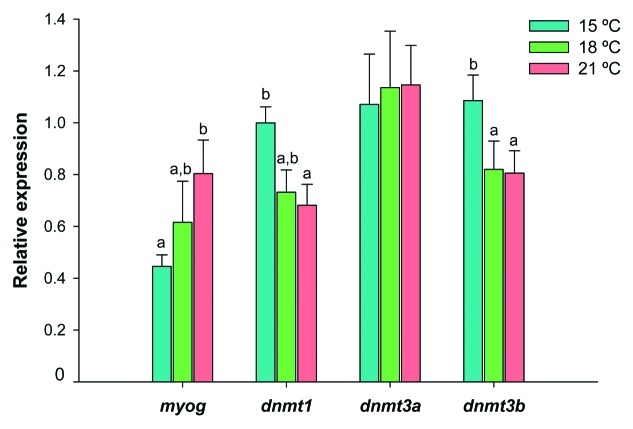
Figure 3. Relative expression of myog, dnmt1, dnmt3a and dnmt3b in Senegalese sole larvae reared at 15°C (blue bars), 18°C (green bars) and 21°C (red bars) until metamorphosis stage 2 (see main text for details). Transcript levels were determined by qPCR and normalized within each developmental stage, using eef1a1, rps4 and ubq as endogenous reference genes. Error bars indicate the standard error of the means for each treatment (n = 6). For each gene, significant differences between temperatures are indicated by different letters (without letters in common, p < 0.05).

An official website of the United States government
Here's how you know
Official websites use .gov
A
.gov website belongs to an official
government organization in the United States.
Secure .gov websites use HTTPS
A lock (
) or https:// means you've safely
connected to the .gov website. Share sensitive
information only on official, secure websites.
