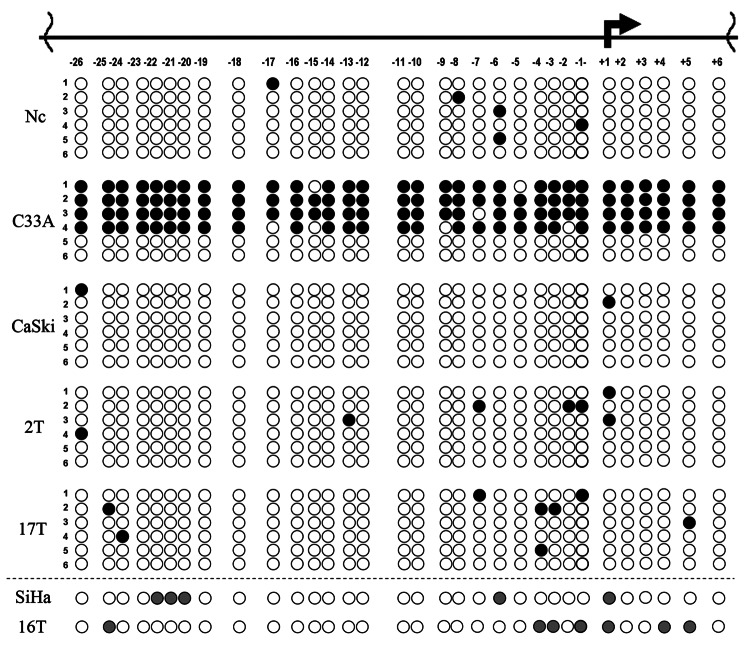
Figure 4. Analysis of methylation status of RASSF1 promoter in cervical SCC samples and cell lines. Schematic representation of results of sodium bisulfite sequencing: numbers under the horizontal line indicate CpG dinucleotides within RASSF1 promoter, the broken arrow – transcription initiation site; black circle,methylated CpG; white circle, unmethylated CpG; gray circle, partially methylated CpG; each row of circles represents a cloned DNA molecule for all samples excepting SiHa and number 16T, where the total PCR products are presented; T, tumor; Nc, normal cervix. Numbers of tumors correspond to Table 4.

An official website of the United States government
Here's how you know
Official websites use .gov
A
.gov website belongs to an official
government organization in the United States.
Secure .gov websites use HTTPS
A lock (
) or https:// means you've safely
connected to the .gov website. Share sensitive
information only on official, secure websites.
