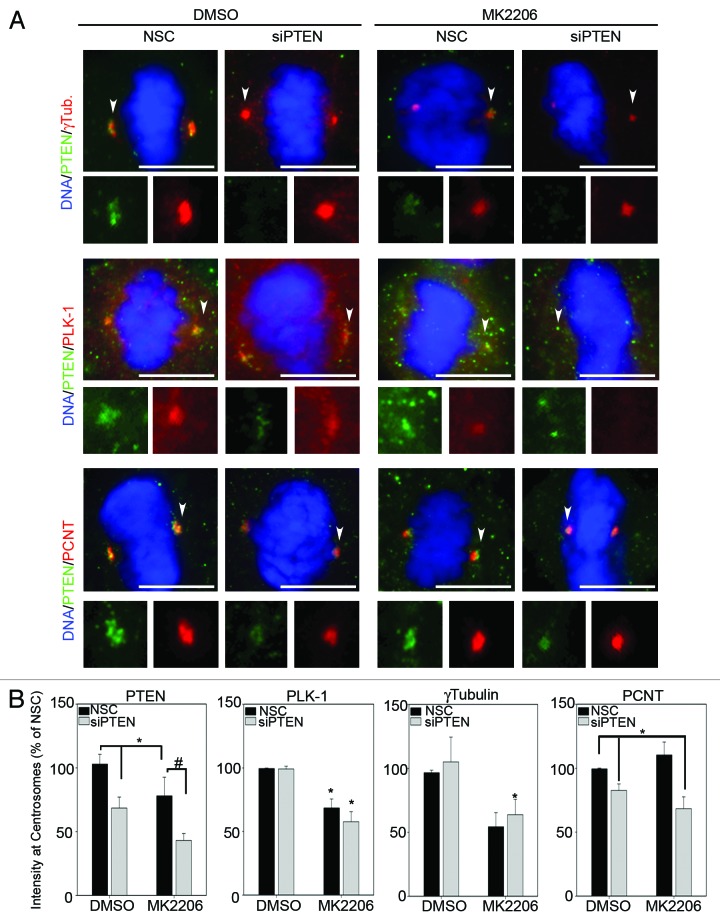
Figure 5. Centrosome composition is regulated by Akt. (A) Immunofluorescence analysis for the indicated proteins was performed on NHEKs transfected with NSC- or PTEN-specific siRNA followed by 10 μM MK2206 or DMSO control treatment for 16 h. Arrowheads point to the centrosome enlarged bottom panels; Bars = 5 μm. (B) The mean fluorescent intensities of each protein at mitotic centrosomes, relative to NSC/DMSO-treated cells, are plotted. Error bars represent S.E.M. from three separate experiments, at least 25 centrosomes measured for each protein per condition per experiment. *p values ≤ 0.05; #p values ≤ 0.009.

An official website of the United States government
Here's how you know
Official websites use .gov
A
.gov website belongs to an official
government organization in the United States.
Secure .gov websites use HTTPS
A lock (
) or https:// means you've safely
connected to the .gov website. Share sensitive
information only on official, secure websites.
