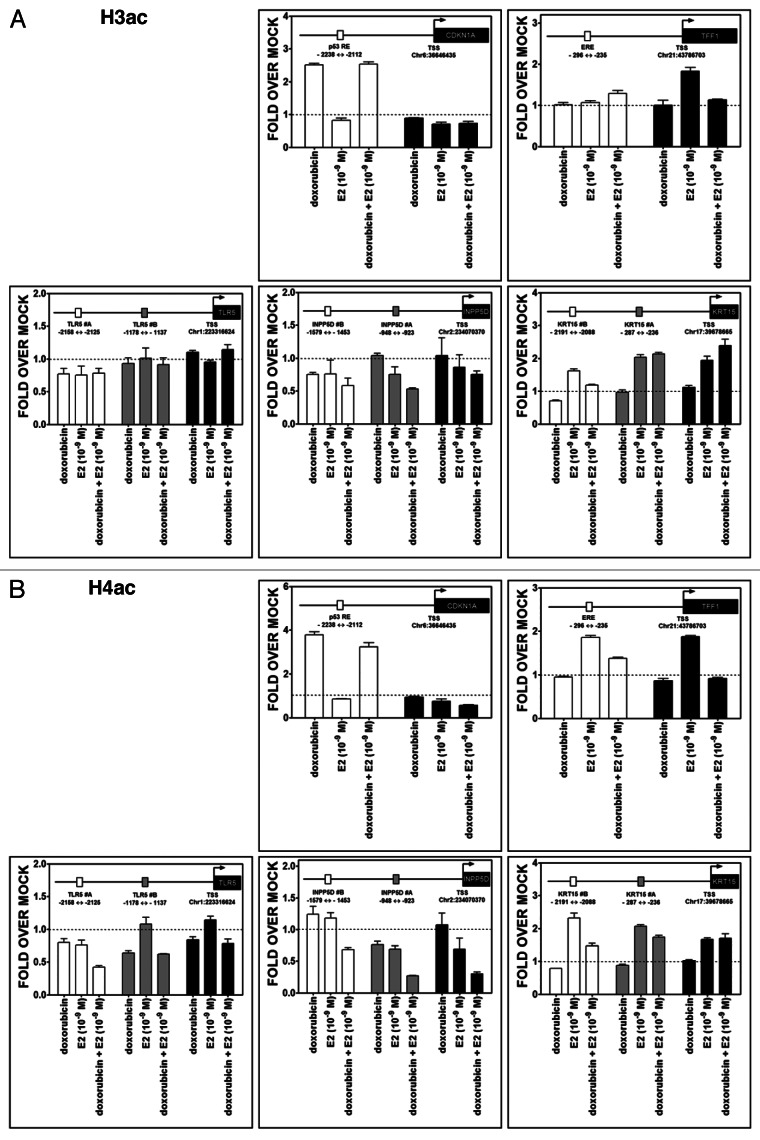
Figure 8. Treatment-induced histone acetylation changes at CDKN1A, TFF1, TLR5, INPP5D and KRT15 promoter regions. Chromatin immunoprecipitation assays were performed using antibodies against pan-H3Ac (06–599, Millipore) (A) or pan-H4Ac (06–866) (B), as described for Figures 6 and 7. The colors of the bars indicate the promoter regions that were amplified and match the boxes that are placed in the schematic drawing of the genes on the top of each figure. The distance from TSS of the promoter regions that were examined is indicated.

An official website of the United States government
Here's how you know
Official websites use .gov
A
.gov website belongs to an official
government organization in the United States.
Secure .gov websites use HTTPS
A lock (
) or https:// means you've safely
connected to the .gov website. Share sensitive
information only on official, secure websites.
