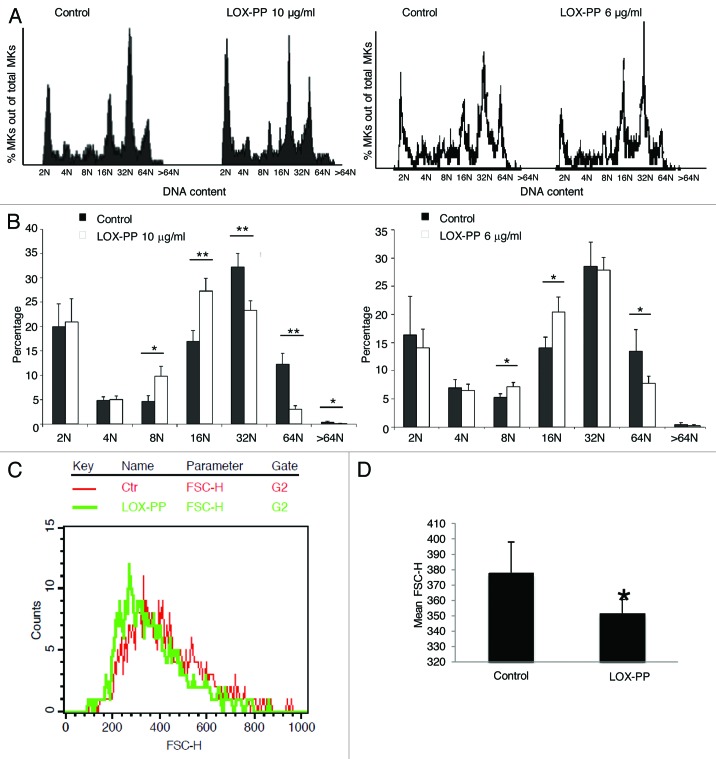
Figure 1. Effect of LOX-PP on MK ploidy and size. (A) Bone marrow cultures were treated with 25 ng/ml TPO in the presence of 10 µg/ml or 6 µg/ml LOX-PP or vehicle (H2O) for 3 d. Cells were subjected to MK ploidy analysis, using flow cytometry. Representative histogram plots for vehicle and LOX-PP treatments are shown. (B) Quantification of ploidy status per group. Data are averages of at least four experiments ± SD. Statistical analysis was applied using the Student’s t-test, *p < 0.05, **p < 0.01. (C) Estimation of MK size based on FACS analysis. MKs were gated based on CD41 expression on a FSC-H histogram plot. A representative plot is shown (red, control; green, Lox-PP). (D) Quantification of MK size based on mean forward scatter (FSC-H) values. Statistical analysis was applied using the Student’s t-test, n = 5, *p < 0.05.

An official website of the United States government
Here's how you know
Official websites use .gov
A
.gov website belongs to an official
government organization in the United States.
Secure .gov websites use HTTPS
A lock (
) or https:// means you've safely
connected to the .gov website. Share sensitive
information only on official, secure websites.
