
Figure 4. DKI cell lines show phosphorylation of Akt and Erk.
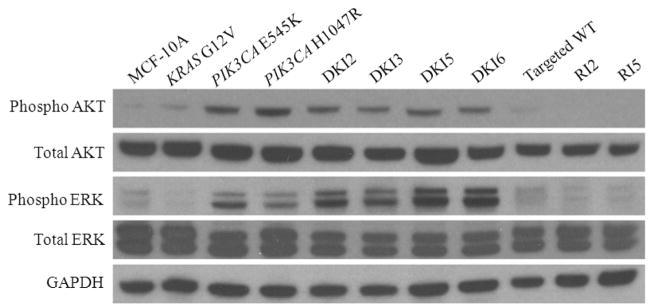
Western blot demonstrating levels of phosphorylated Akt (Ser-473), total Akt, phosphorylated Erk (Thr-202/Tyr-204), total Erk, in DKI cell lines and controls in the absence of EGF. GAPDH is shown as a loading control.