
Figure 5.
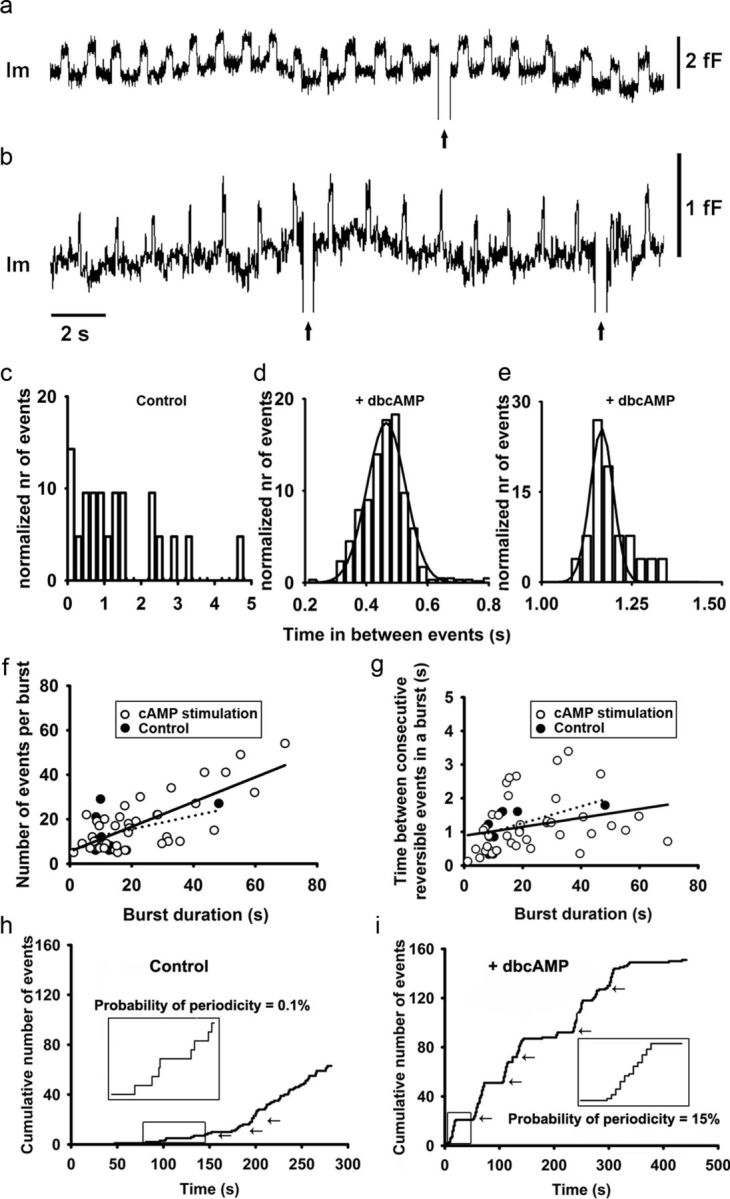
The addition of dbcAMP results in rhythmic reopening of the same fusion pore. a, b, Two epochs of the representative Im traces showing rhythmic fusion pore activity in two different cells after the addition of dbcAMP. This activity was part of two bursts (Fig. 1e for definition) with durations of 180 and 41 s. c–e, Representative histograms of times in between ensuing transient exocytic events within a burst in controls (c) and after the addition of dbcAMP (d,e). The histogram of controls shows a random distribution, whereas histograms after the addition of dbcAMP (which are partially shown in a,b) appear normally distributed and were fitted with Gaussian curves with the mean values of 0.465 ± 0.001 s (n = 645 events) and 1.166 ± 0.002 s (n = 26 events), respectively. f, The number of reversible events in a burst depends on the burst duration. The control data points were fitted with the regression line (dotted line) with parameters: y (number of events per burst) = (0.30 ± 0.27) × x (burst duration in seconds) + (10 ± 6) (correlation coefficient r = 0.41, n = 8 bursts, p = 0.3) and after stimulation with cAMP (solid line): y (number of events per burst) = (0.56 ± 0.08) × x (burst duration in seconds) + (6 ± 2) (correlation coefficient r = 0.76, n = 44 bursts, p < 0.001). The number of bursts of controls is much reduced. g, The time between consecutive reversible events in a burst did not depend on the burst duration. Control data points were fitted with the regression line (dotted line) with parameters: y (time between consecutive reversible events in a burst in seconds) = (0.025 ± 0.015) × x (burst duration in seconds) + (0.8 ± 0.3) (correlation coefficient r = 0.57, n = 8 bursts, p = 0.1); and after cAMP stimulation, data points were fitted with the regression line (solid line) with parameters: y (time between consecutive reversible events in a burst in seconds) = (0.013 ± 0.007) × x (burst duration in seconds) + (0.9 ± 0.2) (correlation coefficient r = 0.27, n = 44 bursts, p = 0.08). The burst duration of controls was typically <20 s. h, The cumulative number of reversible events as a function of time in a representative control cell. Arrows indicate bursts of reversible events. Inset, Magnified epoch (rectangle) where the time between ensuing reversible events is random. i, The cumulative number of reversible events as a function of time in a representative cell after the addition of dbcAMP. Arrows indicate bursts of reversible events. Inset, Magnified burst (rectangle) with remarkably constant time between ensuing reversible events.