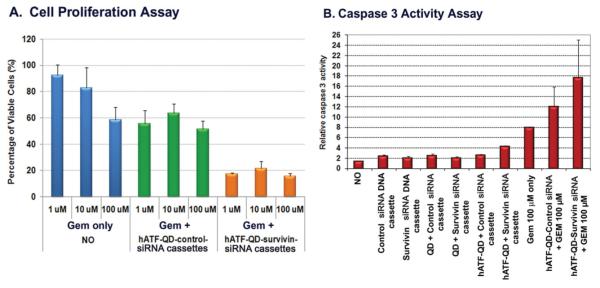
Figure 7.

Combination effect of survivin gene silencing and drug treatment A) Cell proliferation assay. The O.D. value of no treatment cells was used as 100%. Student’s t-test: Gem only vs. Gem + hATF-QD-Survivin siRNA expressing cassettes, p < 0.0005 for all three concentrations. B) Caspase 3 activity assay. O.D. value from the non treated cell lysate was used as 1.
