
Figure 4.
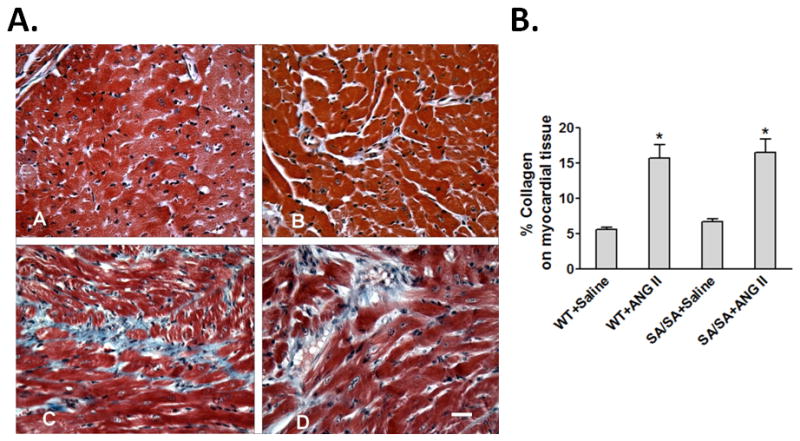
Hypertension-induced cardiac collagen. (A) Trichrome staining of myocardium. Panel A, WT+Saline: Typical cross-sectional morphology of myocardium in the left ventricle of WT mice. Panel B, SA/SA+Saline: Typical cross-sectional morphology of myocardium in left ventricle of SA/SA mice. Panel C, WT+ANG II: An increase in collagen (blue stain) is seen as small foci of fibrosis scattered in the left ventricular myocardium. Panel D, SA/SA+ANG II: The collagen fibrosis comprises larger regions and appears more extensive in SA/SA left ventricular myocardium. Scale bar = 50 μm. Bar Graph: Percent change in collagen among WT and SA/SA mice treated with saline or ANG II. *P < 0.05 SA/SA+ANG II and WT+ANG II vs. both saline controls; Kruskal-Wallis ANOVA followed by Dunn’s post hoc test.