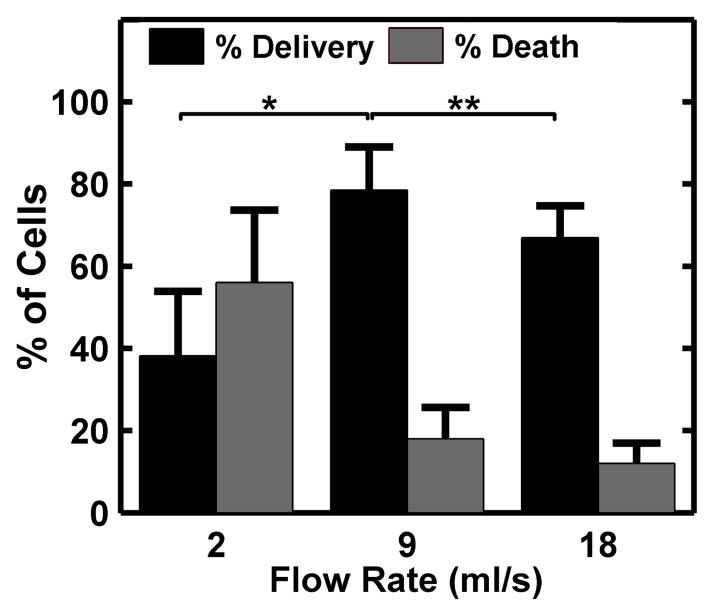
Figure 5.
Calcein delivery efficiency and percent cell death at 2, 9, and 18 ml/s flow rates. The ultrasound peak negative pressure was maintained at 300 kPa and the FFMD produced 10 μm PFB microbubbles at a rate of 300,000 microbubbles/s. (Plotted as mean + standard deviation, n > 3, * = p < 0.01, ** = p < 0.05).

