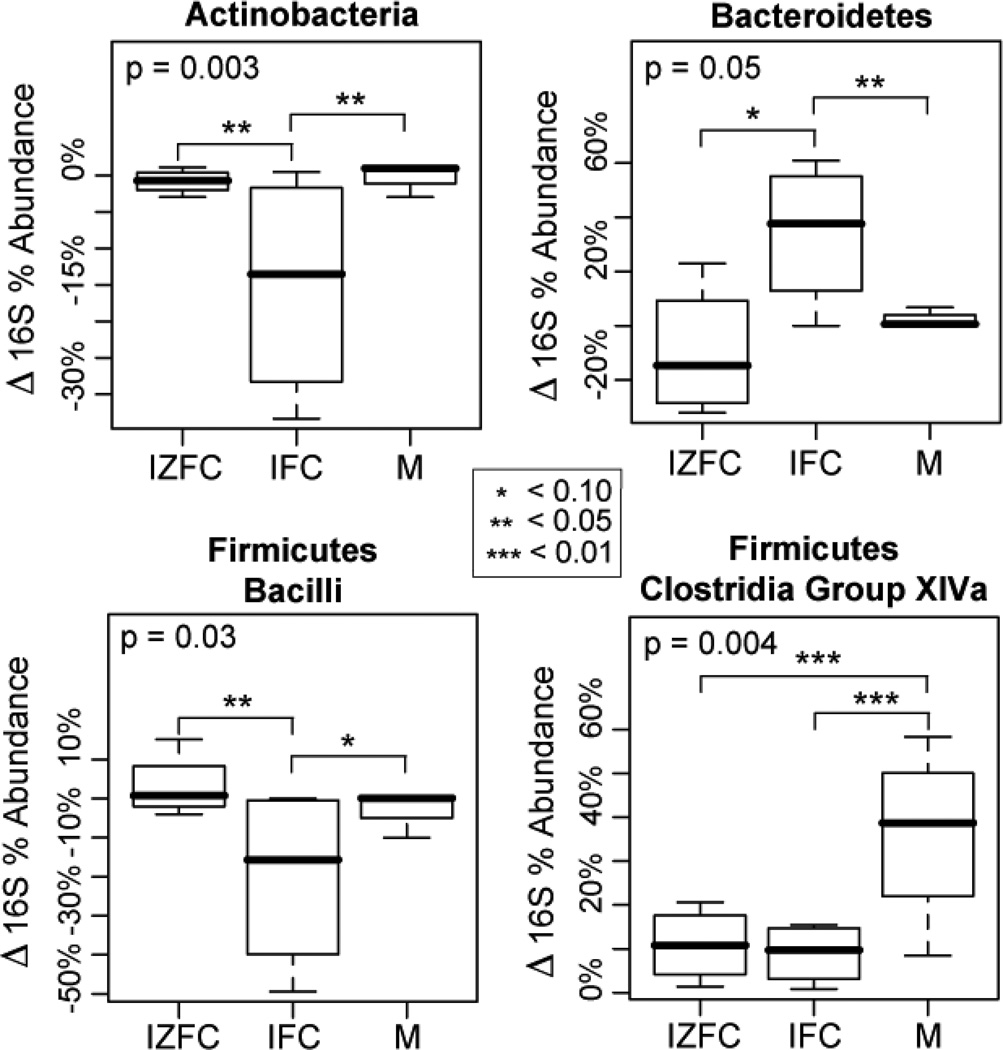
Figure 5.
Age-dependent changes in relative abundances of select phyla/sub-phyla between treatment groups. X-axis: three feeding groups. Y-axis: differences in percent abundances of bacterial groups from 5 to 9 months of age (%9mo - %5mo). Statistical significance was tested by ANOVA and adjusted for the potentially confounding variable for total dietary iron (TDI). Overall P-values are indicated in upper left corners of each boxplot, and P-values less than 0.1 are noted by asterisks. The analysis of all phylum/sub-phylum categories is presented in Figure 6, online.

