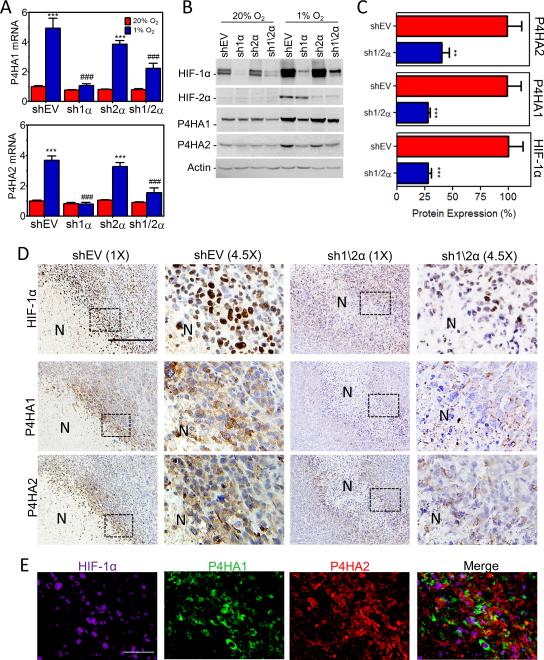
Figure 1.
Knockdown of HIF-1α blocks P4HA1 and P4HA2 induction under hypoxic conditions. A, expression of P4HA mRNAs was analyzed by RT-qPCR in MDA-MB-231 subclones exposed to 20% or 1% O2 for 24 hours (mean ± SEM, n = 3, ANOVA); ***P < 0.001 vs shEV (20% O2); ### P < 0.001 vs shEV (1% O2). B, immunoblot assays were performed using lysates from MDA-MB-231 subclones exposed to 20% or 1% O2 for 48 hours. C, immunoblot assays (Supplementary Figure S1D) of tumor lysate were quantified by optical density and normalized to MDA-MB-231-shEV expression (mean ± SEM , n = 5, Student's t test). **P < 0.01, ***P < 0.001 vs shEV. D, immunohistochemical staining of serial sections from shEV and sh1/2α tumors. Scale bar = 150 μm. N = Necrotic region. E, shEV images (in D) were deconvoluted and pseudocolored to assess colocalization. Scale bar = 25 μm.

