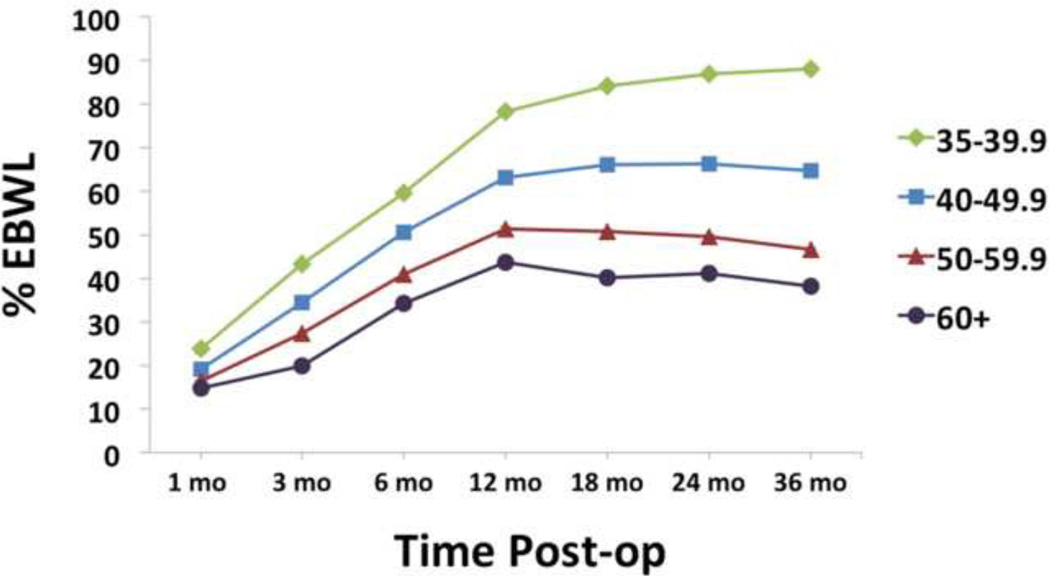
FIGURE 1.
Percent excess body weight loss (%EBWL). Lighter vs. heavier individuals showed greater %EBWL at all time points (all p’s < 0.0005). Note: error bars (standard error of the mean) are included in all figures, but may not visible due to the small standard error relative to the size of the icons denoting different BMI categories.

