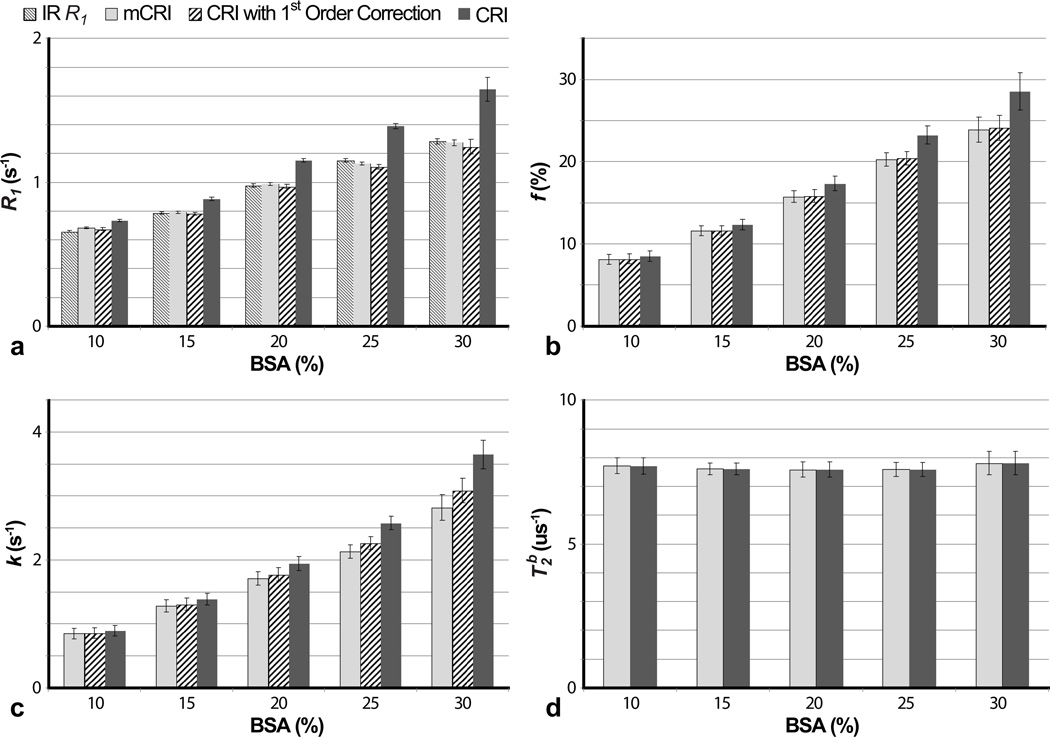
Figure 3.
Comparison of qMT parameters estimated using original CRI (without and with first-order correction) and mCRI in phantoms with different BSA concentrations. a: R1 measurements. IR R1 values are shown for reference. b,c,d: f, k, and T2B measurements, respectively. Error bars indicate standard deviations in ROI measurements taken from parameter maps.

