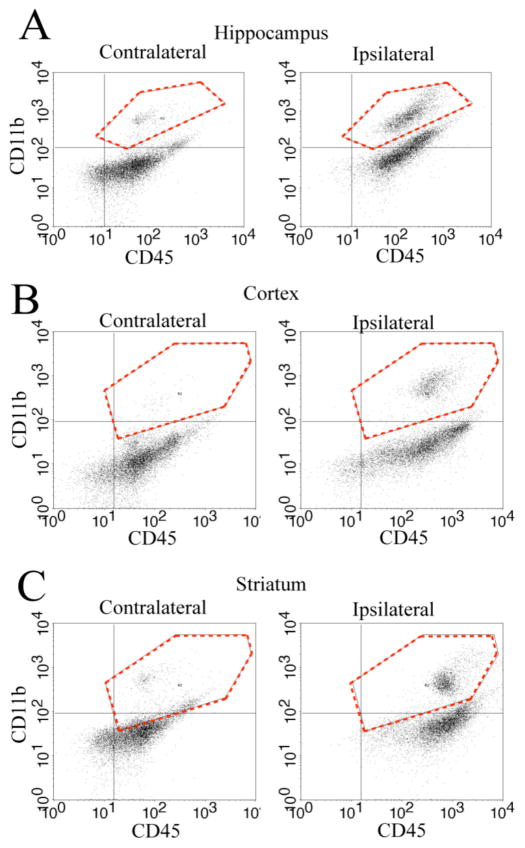
Figure 1. HI triggers accumulation of microglia/macrophage in P9 ischemic brains.
A–C. Representative flow cytometry scatter plots of CD11b+/CD45+ cells in different brain regions (hippocampus, cortex, and striatum). Data were collected from the contralateral (CL) and ipsilateral (IL) hemispheres in P9 mice at 2 days post-HI (A) or 9 days post-HI (B; C). Y-axis: number of CD11b+ cells. X-axis: number of CD45+ cells. Dashed red line in the upper right quadrants: CD11b+/CD45+ cell population gated for further analysis in Figure 2–3.

