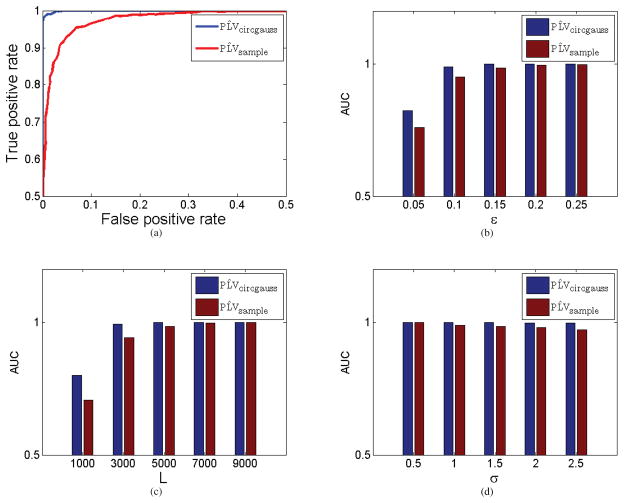
Figure 7.
Roessler oscillator simulations (a) Comparison of ROC curves of (blue) and (red) when ε = 0.15 for coupled oscillators, standard deviation σ = 1.5 and number of samples L = 5000. (b) Area under ROC curve as a function of coupling parameter ε when σ = 1.5 and L = 5000. (c) Area under ROC curve as a function of number of samples L when σ = 1.5 and ε = 0.15. (d) Area under ROC curve as a function of the standard deviation of the noise σ when L = 5000 and ε = 0.15.

