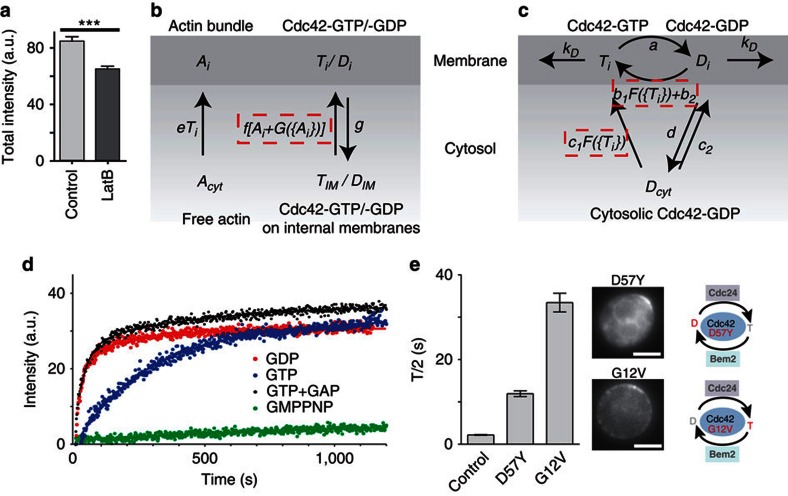
Figure 3. Building a mathematical model of the combined pathways.
(a) Comparison of total intensities of GFPCdc42 caps in controls and LatB-treated cells. Bars indicate means±s.e.m. n>80. ***t-test, P<0.0001. (b,c) Schematic depiction of model reactions for actin- (b) and GDI-mediated (c) recycling pathways. See Supplementary Methods and Supplementary Tables S1,S2 for details of reactions and parameters. Non-linear feedback reactions are indicated by dashed boxes. (d) Extractability of Cdc42 from hexadecanoylaminofluorescein (HAF)-labelled liposomes loaded with the indicated methylanthraniloyl-modified (Mant-) nucleotides. (e) Halftimes (FRAP T/2) for localization of inactive Cdc42D57Y (n=16) and constitutively active Cdc42G12V (n=16). Bars indicate mean±s.e.m. The schematics illustrate changes in the Cdc42 GTPase cycle. Scale bar, 4 μm.

