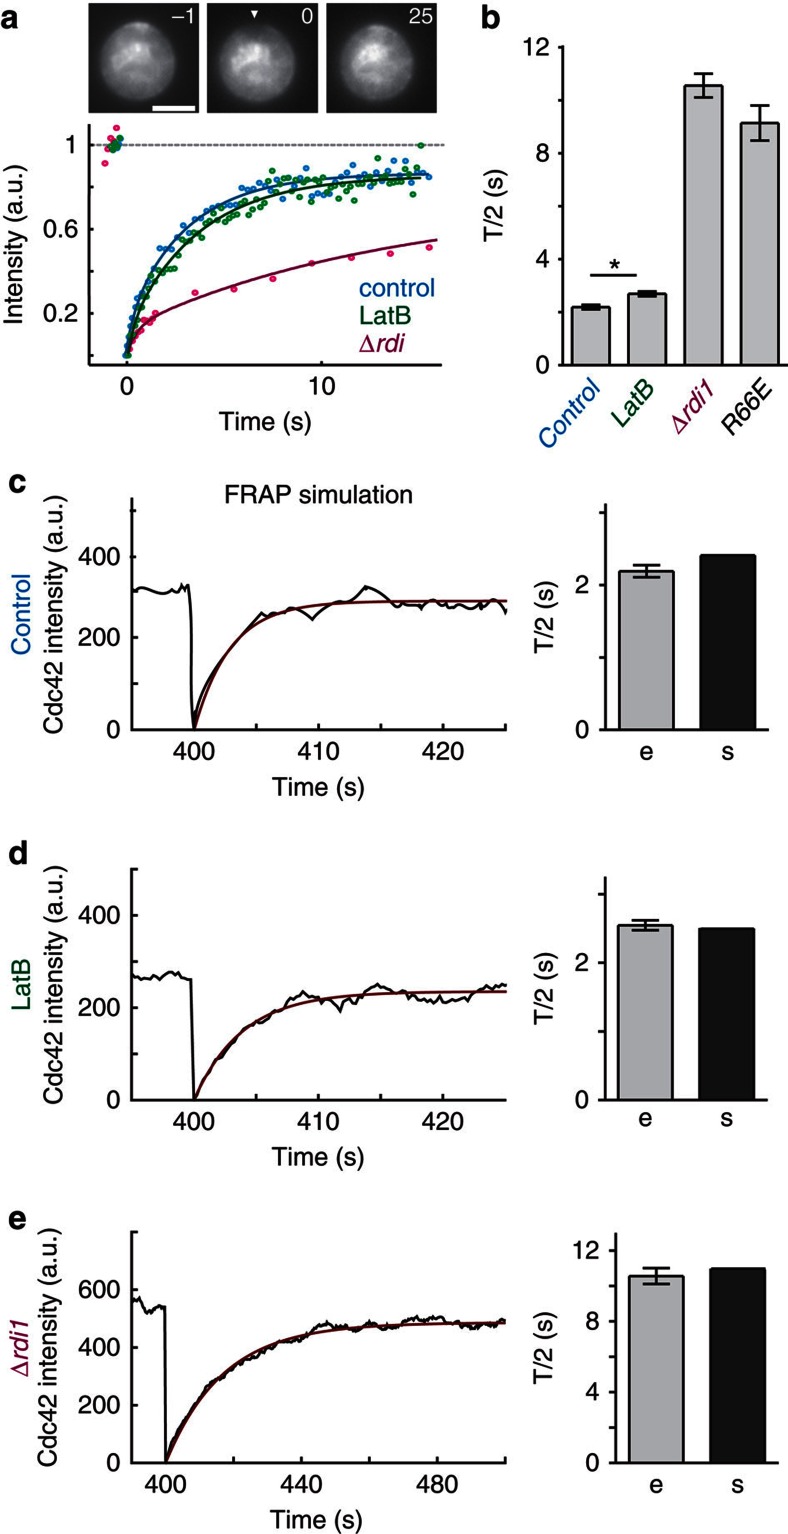
Figure 5. Fitting Cdc42 turnover parameters.
(a,b) Representative FRAP curves (a) and FRAP T/2 values (b) for GFPCdc42 in controls (n=56), Δrdi1 cells (n=20), cells expressing GFPCdc42R66E (n=11) and cells treated with LatB (n=24). The arrowhead in (a) indicates the position targeted for FRAP. Bars in (b) represent means±s.e.m. *: t-test, P<0.05. Time is indicated in s. Scale bar, 4 μm. (c–e) Simulated (black) FRAP curves and exponential fits (red), and comparison of T/2 values for simulated (s) and experimental (e, identical to bars in (b)) recovery. Actual and simulated FRAP data are shown for control (c), LatB-treated (d) and Δrdi1 (e) cells.

