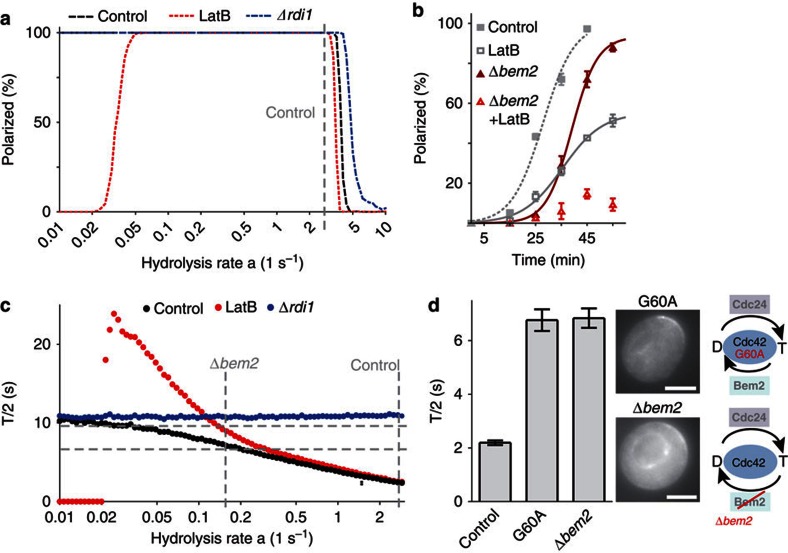
Figure 6. Effects of GTP hydrolysis on polarization efficiency and Cdc42 dynamics.
(a) Predicted dependence of polarization efficiencies in control, LatB-treated and Δrdi1 cells on the rate of GTP hydrolysis. The hydrolysis rate for control cells (a=2.74 s−1) was estimated by fitting model parameters (Figs 4, 5), and is indicated by the vertical dashed grey line. (b) Polarization efficiency of Cdc42 in control and Δbem2 cells in the presence or absence of LatB. Data points represent means of three experiments with 50 cells each. Error bars indicate s.d. The lines are sigmoidal fits. (c) Plot of simulated Cdc42 FRAP T/2 (mean values from 400 runs/data point) against rate of GTP hydrolysis. Fitted and estimated hydrolysis rates in control and Δbem2 cells are indicated as vertical dashed grey lines. T/2 values measured in Δbem2 cells without (6.8 s; n=20) and with LatB (9.6 s, n=12) are indicated as horizontal dashed grey lines. (d) FRAP T/2 and localization of Cdc42 in Δbem2 cells and in cells expressing Cdc42G60A (n=11), a mutant with a lower GTPase activity. Bars represent means±s.e.m. Schematics illustrate changes in the Cdc42 GTPase cycle. Scale bar, 4 μm.

