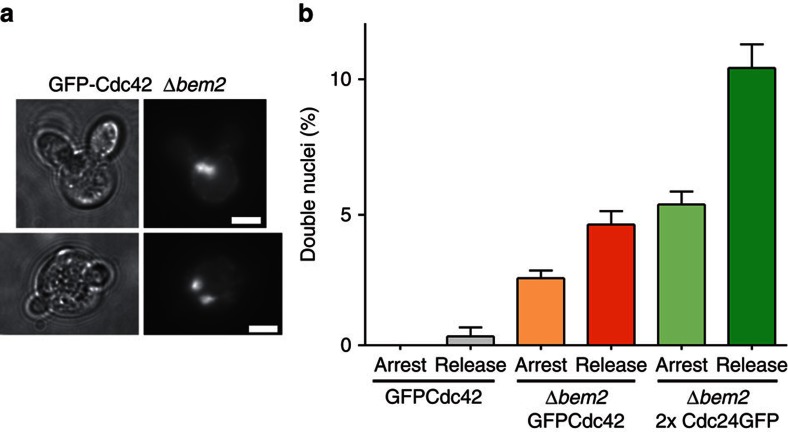
Figure 8. Multiple polarization sites and DNA segregation.
(a) Examples of Δbem2 cells displaying two nuclei and two buds. Scale bar, 4 μm. (b) Percentage of cells with two nuclei in controls and in Δbem2 cells expressing GFPCdc42 or two copies of Cdc24GFP. Bars represent means±s.e.m. for three experiments with 100 cells each.

