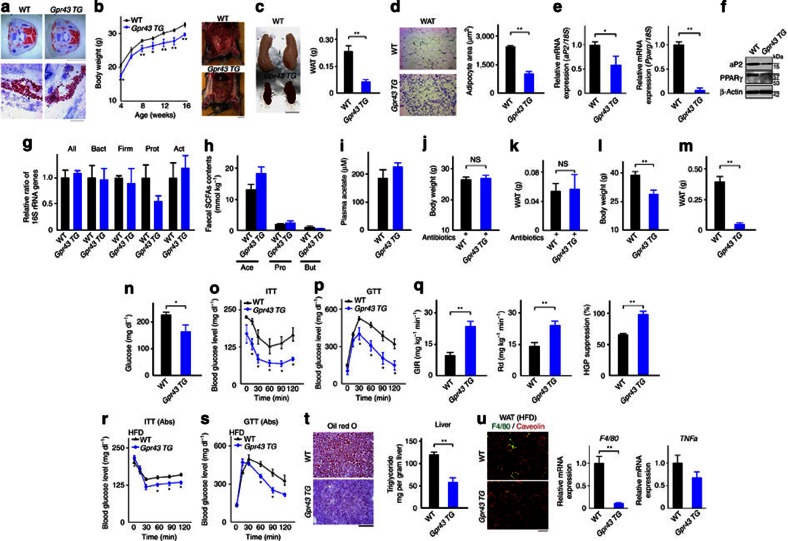
Figure 3. Adipose tissue-specific Gpr43 transgenic mice are lean.
(a) Subcutaneous WAT and interscapular BAT of littermates (P1) were stained with oil red O. Scale bar: 5 mm (upper), 100 μm (lower). Body weight changes (b, n=6–8) and fat mass (c, n=6, 5). Scale bar, 1 cm. (d) Haematoxylin–eosin (H&E)-stained epididymal WAT and mean area of adipocytes (n=4, 3). Scale bar, 100 μm. Expression of aP2 and Pparg mRNA (e, n=6, 5) and protein (f) in the WAT; β-actin was used as a loading control. (g) Comparison of microbial communities, as assessed by qPCR (n=4). Faecal major SCFA (h, n=4) and plasma acetate (i, n=5) contents in aP2-Gpr43TG mice fed an HFD (n=4). Body weight (j) and fat mass (k) under antibiotic treatment (n=7, 6). Body weight (l) and fat mass (m) of aP2-Gpr43TG mice fed an HFD (n=7). (n) Plasma glucose concentration in aP2-Gpr43TG mice fed an HFD (n=6). ITT (o) and GTT (p) in aP2-Gpr43 TG mice fed an HFD (n=6, 5). (q) Euglycaemic hyperinsulinaemic clamp in aP2-Gpr43TG mice fed an HFD. Left: glucose infusion ratio; middle: glucose disposal rate; right: hepatic glucose production suppression. Body weights; WT (44±1.3 g): aP2-Gpr43TG (33±1.1 g), 17 weeks of age (n=6, 5). ITT (r) and GTT (s) in aP2-Gpr43TG mice fed an HFD under antibiotic treatment (n=3). (t) Oil red O-stained liver and hepatic triglyceride content in aP2-Gpr43 TG mice fed an HFD (n=6, 4). Scale bar, 100 μm. (u) Level of WAT inflammation. Merged images from WAT, costained with anti-F4/80 (green) and anti-caveolin1 (red) antibodies (left panel). Scale bar, 100 μm. Expression of F4/80 (middle panel, n=4–5) and TNFa (right panel, n=4–6) mRNA in the WAT. Mice were analysed at 16 weeks of age. All data are presented as mean±s.e.m. Student’s t-test; *P<0.05; **P<0.005; NS, not significant.

