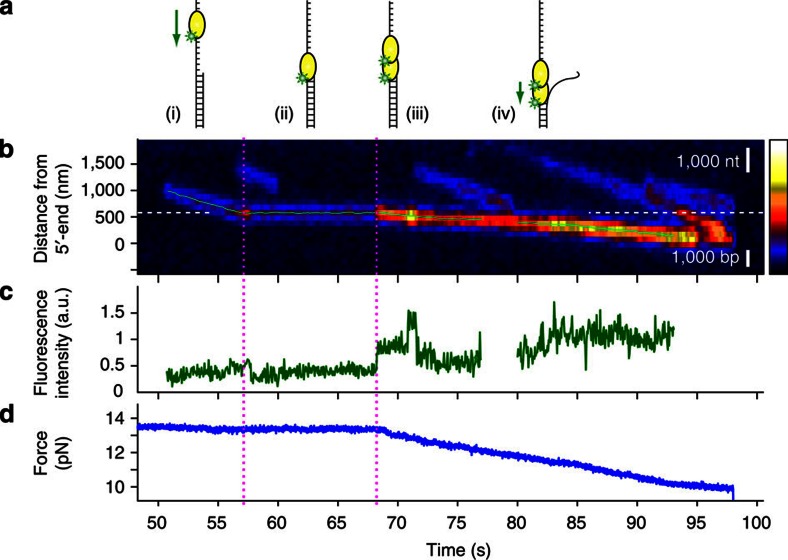
Figure 5. The duplex DNA segment blocking translocation of UvrD is unwound as another UvrD binds to the junction.
(a) Schematic drawings of this unwinding event: (i) one UvrD translocates until it encounters an ssDNA/dsDNA junction; (ii) it stops at the junction; (iii) the second UvrD binds to the junction; and (iv) the helicase unwinds the duplex DNA. (b) A kymogram of this event. White dashed line indicates the projected location of the junction. UvrD stalls at the junction for 15 s. At 68 s (magenta dotted line), there is a sudden increase in fluorescence intensity, followed by resumed UvrD motion, at a slower rate. The position trajectories from the 2D Gaussian fit are overlaid on top (light green). Scale bars for the length of 1,000 nt (ssDNA) and 1,000 bp (dsDNA) at 13.5 pN are shown in white. (c) The fluorescence intensity trajectory. At 68 s (magenta dotted line), there is a sudden increase in fluorescence, which designates the binding event of another UvrD. There is a third binding event (71 s) followed by quick dissociation (or photobleaching, 72 s), but this event does not seem to have a role in unwinding. (d) The force (tension in the DNA substrate) trajectory. The force is stable at 13.5 pN initially, which means no length change in the DNA substrate. At the second magenta dotted line, the force starts to decrease, which is the signature of dsDNA unwinding.

