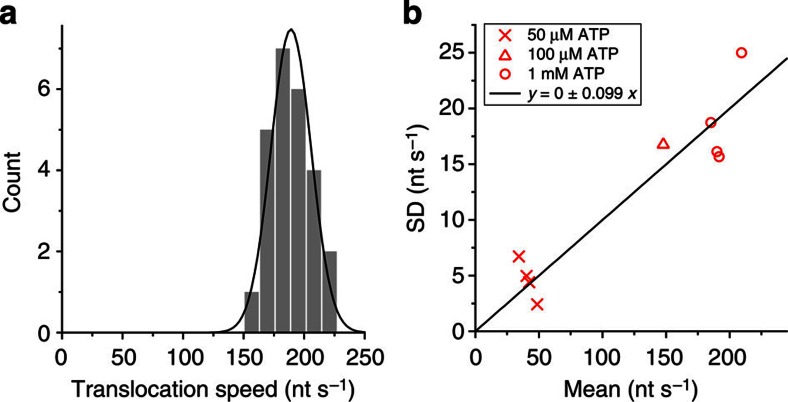
Figure 7. Molecular heterogeneity in the translocation rate of a monomeric UvrD translocase.
(a) The distribution of translocation rates of 28 UvrD molecules on the same DNA substrate (the substrate in Fig. 2) shown with the Gaussian fit (black). The mean and s.d. are 189 nt s−1 and 17 nt s−1, respectively. The spread in this distribution only consists of the measurement error and the molecular heterogeneity, because all events were recorded on the same DNA substrate. (b) For the DNA substrates that had more than eight UvrD translocation events, the mean and the s.d. of the translocation rate are plotted (red). The black line is the linear fit of the data, which yields the coefficient of variation (the ratio of the s.d. to the mean) of 0.10.

