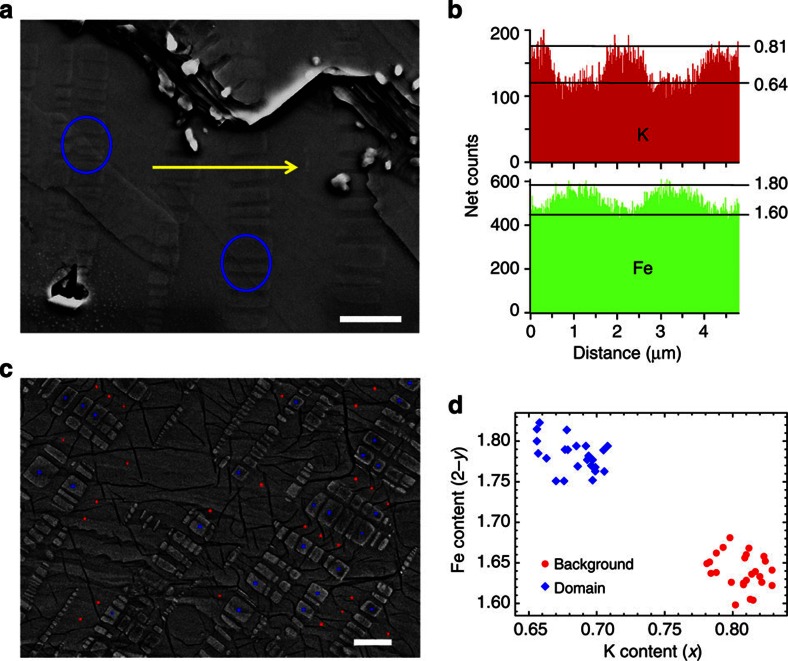
Figure 4. Correlations between the microstructure and the analysis on the compositions.
(a) The topography of one cleaved surface of a sample SFC. Scale bar, 2 μm. One can clearly see the rectangular domains that are buried in the background. The yellow arrowed line highlights the trace along which the spatial distribution of compositions of K and Fe are measured and presented in (b). The large blue circles here mark the positions where the rectangular domains go through several layers along c axis. The outline and shade of the domains can be seen on the layers with different height. (c) The SEM image of the sample SFC in another region. The red spots and blue spots mark the positions where the local compositions are analysed. Scale bar, 2 μm. (d) The compositions of K and Fe measured on the rectangular domains (blue diamond) and the background (red circles). One can clearly see that the data fall into two groups: the formula K0.68Fe1.78Se2 on the domain, and K0.81Fe1.6Se2 on the background. The measurements are done with the voltage of 20 kV.

