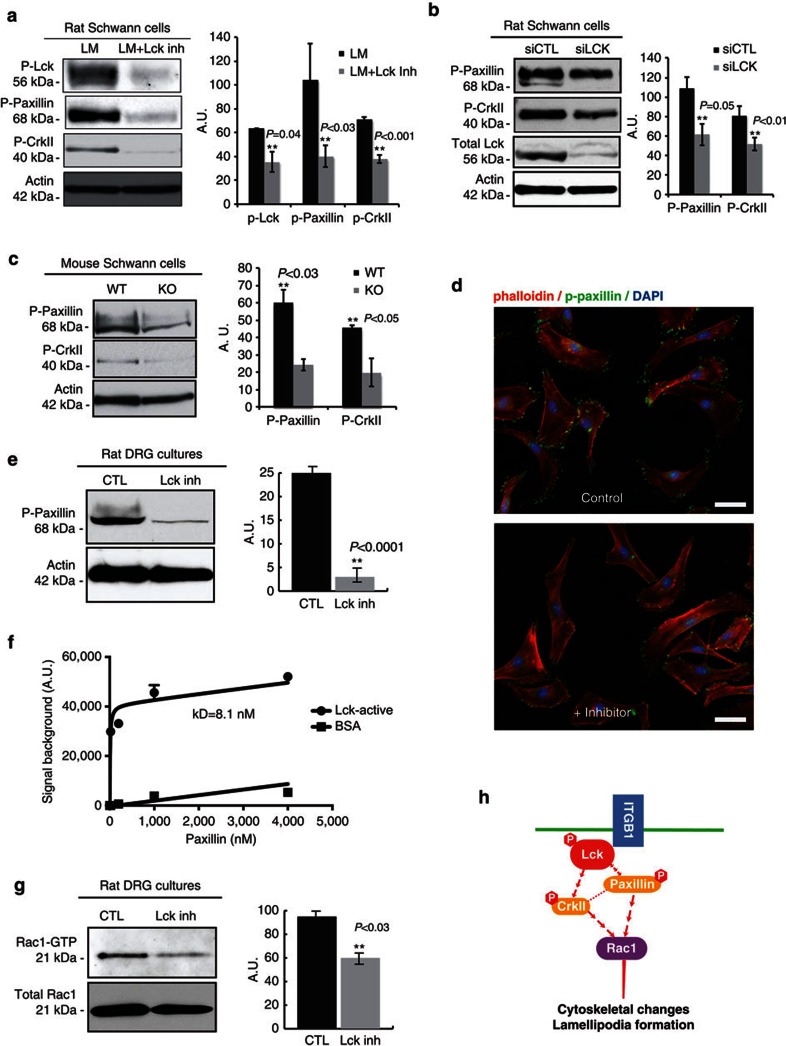
Figure 2. Inhibition of Lck reduces paxillin and CrkII phosphorylation, and Rac-GTP levels in primary RSCs and SC-DRG cocultures.
(a) RSCs seeded on laminin substrate were left untreated (LM) or treated (LM+Lck Inh) with 500 nM Lck inhibitor for 2 h. Lysates were analysed for phospho(Y394)-Lck, phospho(Y118)-paxillin, phospho(Y221)-CrkII and actin as a loading control. Treatment with Lck inhibitor significantly reduced the phosphorylation levels of Lck, paxillin and CrkII (graph shows densitometric quantification from three independent experiments, error bars represent ±s.d.). (b) Lck expression was downregulated with siRNA for 3 days then cells were seeded on laminin substrate for 3.5 h before lysis. Lysates were analysed as in (a). Lck downregulation significantly reduced the phosphorylation of paxillin and CrkII (n=2 independent experiments, error bars represent ±s.d.). (c) Mouse SCs purified from wild-type and Lck−/− mice were seeded on laminin substrate for 3.5 h, then lysates were analysed as in a. Paxillin and CrkII phosphorylation were significantly reduced in Lck−/− SCs (n=2 independent experiments, error bars represent ±s.d.). (d) SCs were stained for phalloidin-rhodamine and phospho(Y118)-paxillin to identify lamellipodia and active paxillin. Paxillin phosphorylation was reduced in Lck inhibitor-treated cultures as compared with control in both radial and axial lamellipodia. (e) Schwann cell-neuron cocultures were treated without (CTL) or with 500 nM Lck inhibitor (Lck inh) for 3 days then lysates were analysed for phospho(Y118)-paxillin. Phospho-paxillin was significantly reduced in cocultures treated with Lck inhibitor for 3 days (P<0.0001, 10 cultures per sample, n=5 experiments, error bars represent ±s.d.). (f) Representative saturation plot for active Lck bound to paxillin is shown (n=duplicate wells, error bars represent ±s.d.). The KD value for paxillin-active Lck binding was 8.1 nM, as determined by nonlinear curve fitting using GraphPad Prism 6.0 software. (g) Schwann cell-DRG cocultures were treated without (CTL) or with Lck inhibitor for 3 days then lysates were analysed for Rac-GTP using a Rac1-GTP pull-down assay. Rac1-GTP was significantly reduced following treatment with Lck inhibitor (P<0.03, 10 cultures per sample, n=3 independent experiments). Total Rac1 remains unchanged. (h) Schematic model of the Lck mediated signalling pathway that regulates cytoskeletal changes and migration in SCs. Scale bars represent 50 μm. Statistical significance was determined by two-tailed Student’s t-test.

