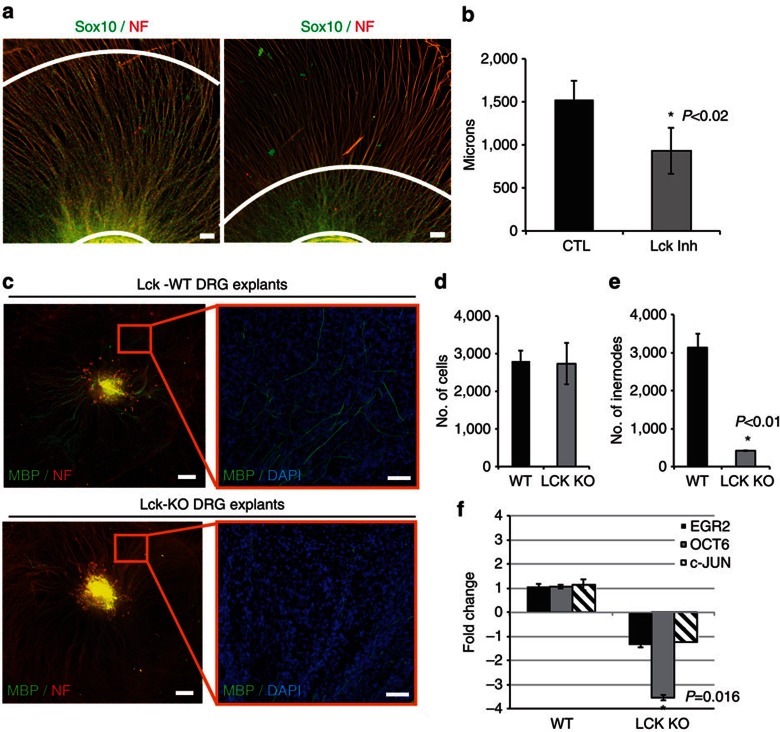
Figure 5. Lck inhibition impedes migration of mouse SCs along axons and Lck−/− DRG explants show decreased myelination.
(a) Mouse DRG explants were isolated and cultured to enhance axonal outgrowth before SC migration out of the explant (see Supplementary Methods). Cultures were treated with DMSO (CTL) or 500 nM Lck inhibitor beginning at day 4 after seeding. Treatment was continuous for 6 days, then cultures were fixed and immunostained for Sox10, neurofilament and 4′,6-diamidino-2-phenylindole (DAPI). Distance from the explant to the edge of the migrated Sox10-positive mouse SCs (white concentric lines) was measured (eight measurements per explant). (b) Lck inhibition significantly reduced the distance that Sox10-positive SCs migrated along the axons (P<0.02, n=4 from two independent experiments, error bars represent ±s.d.). (c) DRG explant cultures from WT or Lck−/− mice were cultured for 17 days to allow complete population of the explant with endogenous SCs, then ascorbic acid was added to the media for 11 days to induce myelination. The cultures were fixed and immunostained for MBP (green), neurofilament (red) and DAPI (blue). Left panels represent compiled mosaic images covering the whole explant culture and the insets (right panels) represent magnified images from the mosaic to depict myelin internodes. (d) Quantification of DAPI-positive nuclei in Lck−/− and WT explants showed no difference in the number of SCs. (e) Quantification of myelin internodes in Lck−/− and WT DRG explants. The number of myelin internodes was significantly reduced in Lck−/− DRG explants (n=2, P<0.01, error bars represent ±s.d.). (f) RNA was isolated from WT and Lck−/− DRG explants 11 days after initiation of myelination (n=2, three cultures per sample). Quantitative real-time PCR (Applied Biosystems) for Egr2, Oct-6, c-Jun and GAPDH mRNA was conducted and the relative RNA abundance, normalized to GAPDH, was determined by the 2−ΔΔCt method. The fold change in mRNA in Lck−/− cultures as compared with WT cultures is shown. The level of Oct-6 mRNA was significantly reduced in Lck−/− cultures as compared with WT (P=0.016, error bars represent ±s.d.). No significant change in Egr2 or c-Jun expression was seen in Lck−/− explants. Scale bars represent 100 μm (a,c inset), 500 μm (c). Statistical significance was determined by two-tailed Student’s t-test.

