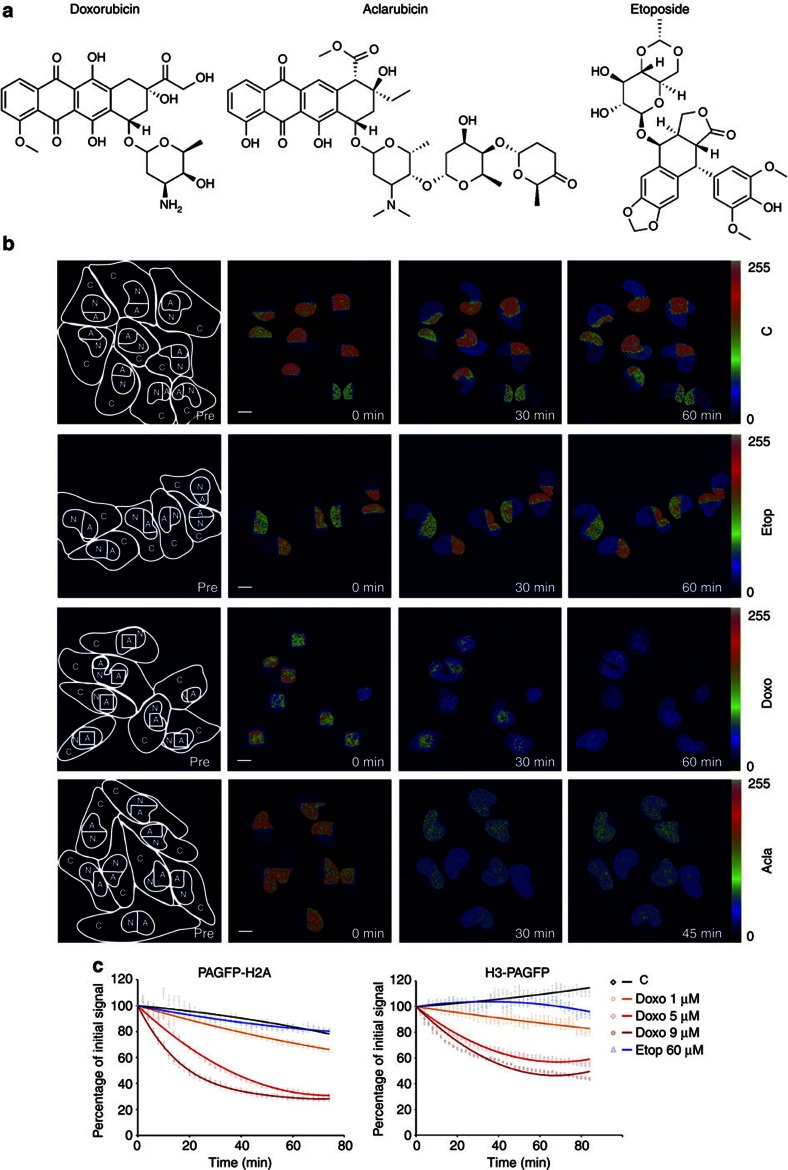
Figure 1. Histone eviction by Doxo.
(a) Chemical structures of three TopoII inhibitors doxorubicin, its variant aclarubicin and the structure of etoposide. (b) Part of the nucleus from MelJuSo cells expressing PAGFP-H2A was photoactivated. The cells were exposed to 9 μM Doxo, 60 μM Etop or 20 μM Acla for the time points indicated and the fate of PAGFP-H2A was monitored by confocal laser scanning microscopy (CLSM). The lines in the left panel show the cell boundaries (C), the nucleus (N) and the activated area (A). The fluorescence intensities are shown in false colours as indicated by the ‘Look-Up Table’. C, untreated control. Scale bar, 10 μm. (c) Quantification of the fluorescence in the photoactivated area of MelJuSo cells expressing PAGFP-H2A or H3-PAGFP after exposure to Etop or different concentrations of Doxo. Cells were monitored as in Fig. 1b. Data points are the mean fluorescence. Trend lines are drawn over experimental data (n=30 to 50 cells, error bar indicates s.e.m.).

