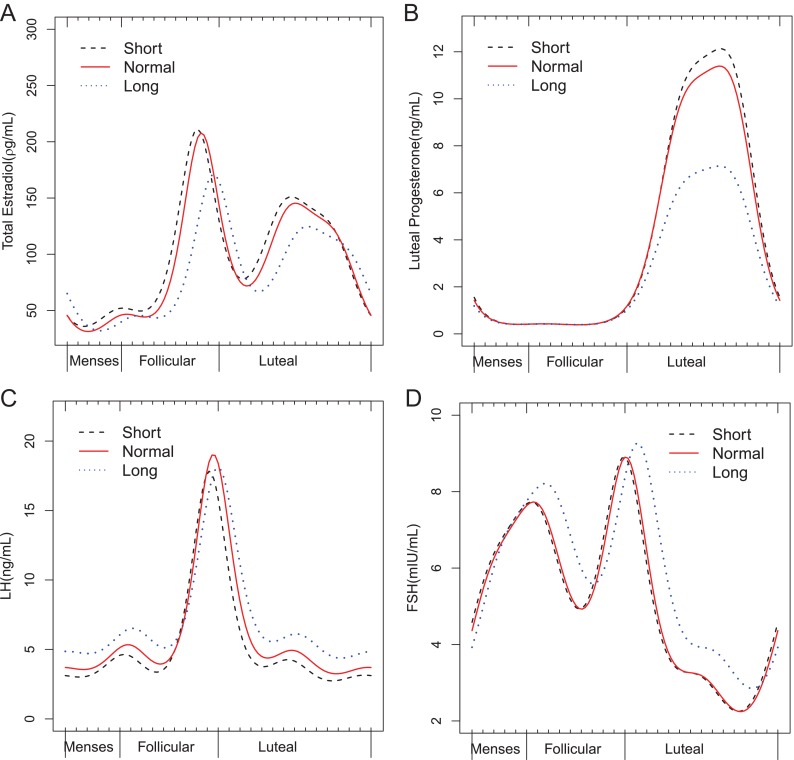
Fig. 2.
Harmonic model results for hormonal profiles during ovulatory cycles (A, estradiol; B, progesterone; C, LH; D, FSH) by cycle length category (short, <26 d; normal, 26–35 d; long, >35 d). The x-axis represents standardized time, which was derived by taking the calendar day of the clinic visit (up to eight per cycle) divided by the observed cycle length, with the cycles further centered on day of ovulation at a time of 0.5.

