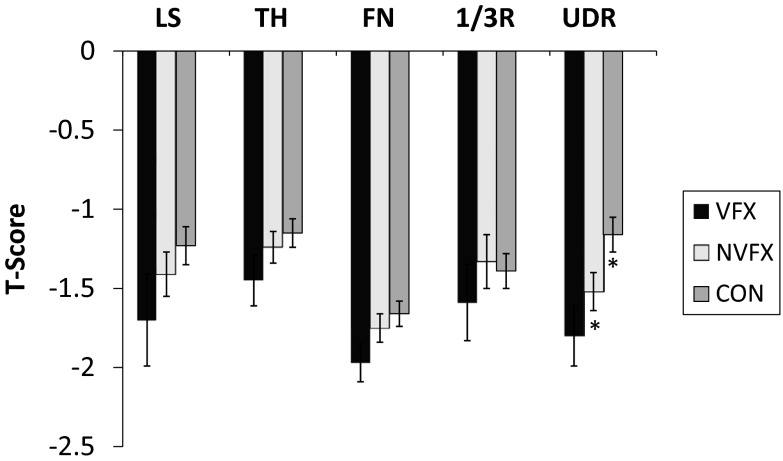
Fig. 1.
Comparison of T-scores (mean ± se) by DXA in postmenopausal women with vertebral fractures (VFX, black bars), nonvertebral fractures (NVFX, light gray bars) and controls (CON, dark gray bars) at the LS, TH, FN, 1/3R, and UDR. No significant differences at any site except for UDR. *, P < 0.05.

