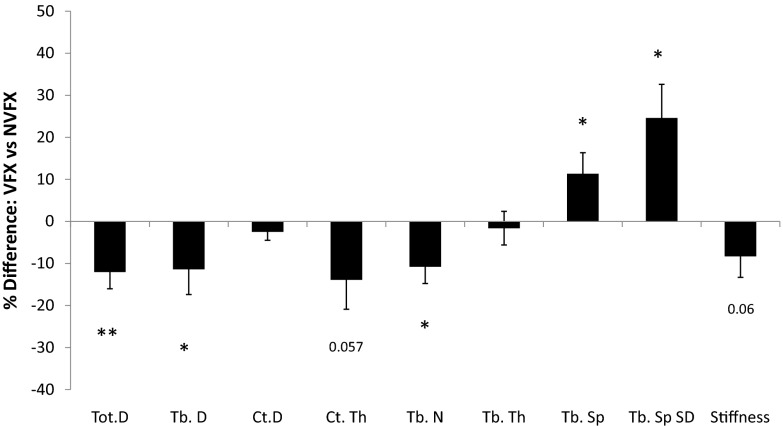
Fig. 4.
Comparison of the percentage difference in vBMD and microarchitecture by HR-pQCT and whole bone stiffness by FEA between vertebral and nonvertebral fracture subjects at the distal tibia. *, P < 0.05; **, P < 0.01 for between group comparisons. Tot.D, total density; Tb.D, trabecular density; Ct.D, cortical density; Ct.Th, cortical thickness; Tb.N, trabecular number; Tb.Th, trabecular thickness; Tb.Sp, trabecular separation; Tb.SpSD, network heterogeneity.

