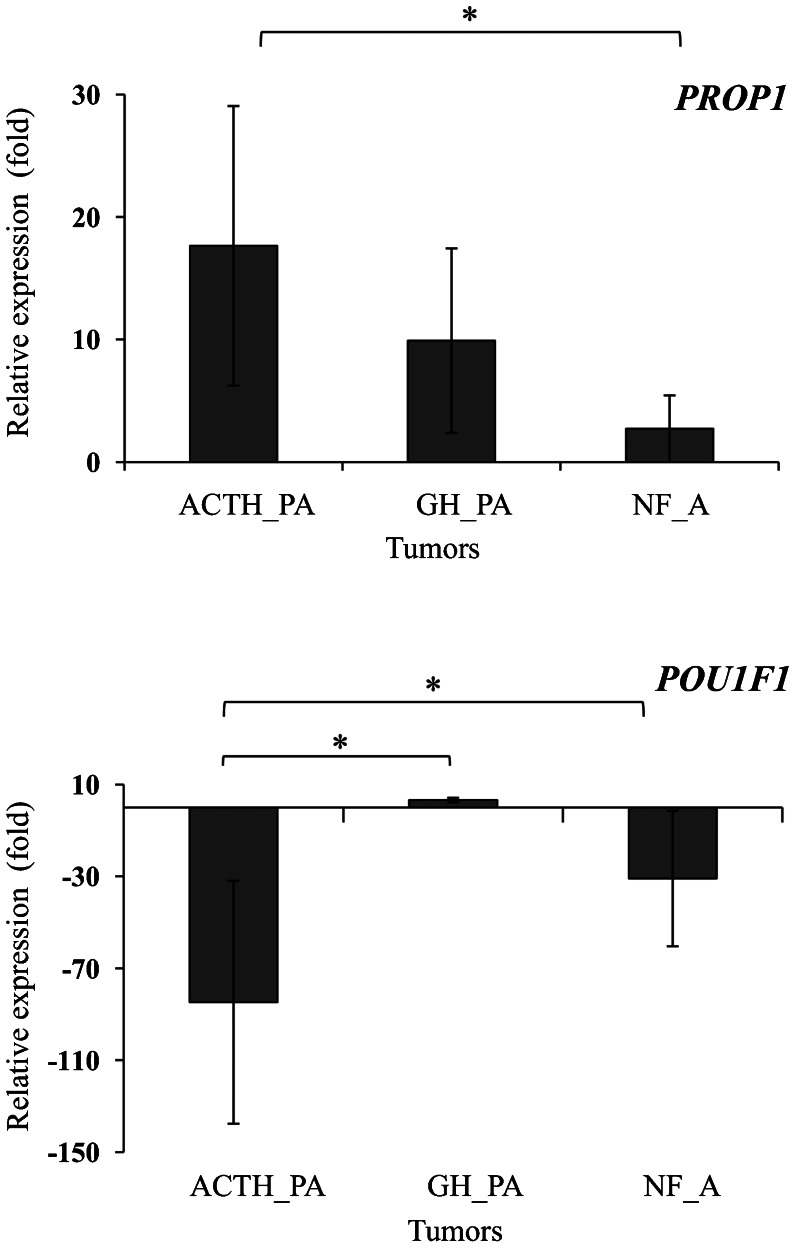
Figure 1.
Transcriptional profile of PROP1 and POU1F1 in pituitary adenomas. Analysis of the RT-qPCR array showed that PROP1 expression was 18-fold higher in the corticotrophinomas, 10-fold higher in the somatotrophinomas, and 3-fold higher in the nonfunctioning adenomas. POU1F1 was overexpressed only in the somatotrophinomas (3-fold increase). The results are expressed as the means ± SD of quadruplicate assays. *p<0.025. ACTH_PA, ACTH-producing adenomas; GH_PA, GH-producing adenomas; NF_A, nonfunctioning adenomas.

