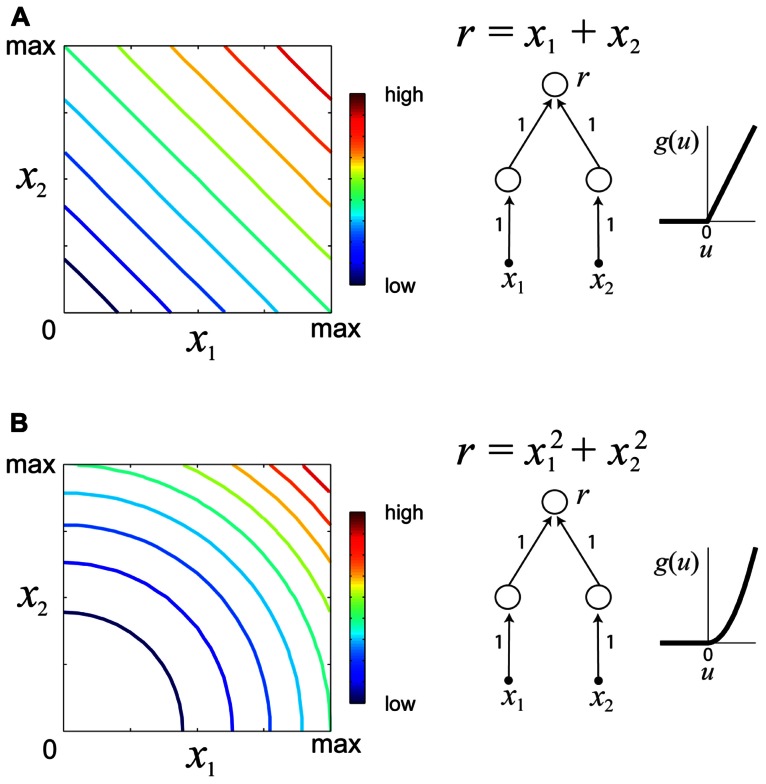
FIGURE 3.
Examples of iso-responses surfaces for two hypothetical sensory processing models. (A) Iso-response contours (left) of a sensory neuron which linearly integrates stimulus variables x1, x2 ≥ 0. The response r of this neuron is a summation of the outputs of two neurons in the lower layer with a threshold-linear gain function (right). Colors in the contour plot represent neural firing rates from low to high. (B) Iso-responses contours (right) of a sensory neuron which non-linearly integrates stimulus variables x1, x2 ≥ 0 with a threshold-quadratic gain function (right).

