
Figure 1.
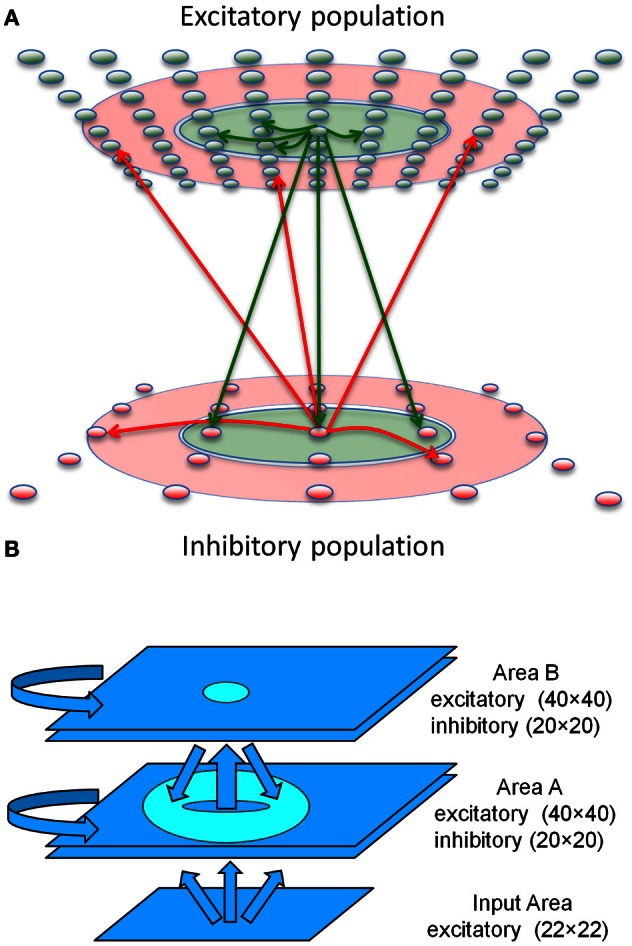
Sequence generation network architecture. (A) Center-Annular-Surround (CAS) network architecture that produces WTA dynamics. The CAS network architecture consists of interconnected spiking neurons, excitatory (green ovals) and inhibitory (red ovals). Each population is arranged in a two-dimensional grid. Connections from representative cells are illustrated. Axons from excitatory neurons (green arrows) project to neurons within green areas. Axons from inhibitory neurons (red arrows) project to neurons in the transparent red annular areas. The CAS connectivity leads to WTA dynamics, in which small regions of high activity are surrounded by large regions with little activity. (B) The sequence generation network is comprised of two reentrantly interconnected Center-Annular-Surround (CAS) spiking networks, Areas A and B. Arrows indicate directions of neural connectivity, while the circle and the donut shape indicate the inter-network connectivity (projection field) from single points in the projecting network. The input area projects non-topographically to Area A. Area A projects topographically to Area B, as indicated by the small oval in Area B. In turn, Area B projects topographically and widely back to area A, but not to the same spot from which it received input, as indicated by the donut-shaped ring in Area A. Avoiding projections to the corresponding spot helped prevent the network from locking into a single activity pattern due to self-amplification. Rather it allowed the network to switch smoothly between patterns in a sequence.