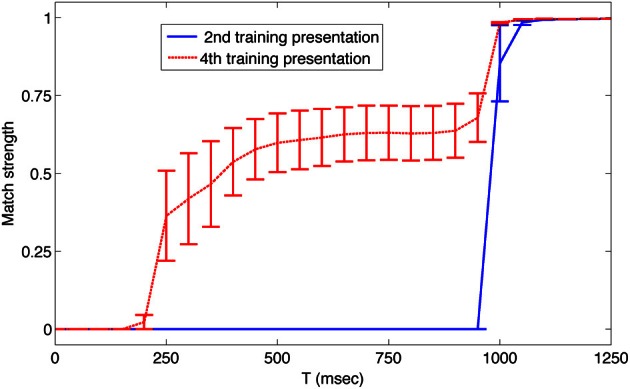
Figure 4.

After training, the simulated neural system anticipates upcoming patterns in the sequence. The average match strength of individual patterns in the sequence is plotted over time during the presentation of the prior pattern. Data was obtained during the second presentation of the sequence from t = 9 to t = 16 s (blue solid line), and during the fourth presentation of the sequence from t = 25 to t = 32 s (red dashed line). During the fourth presentation, 250 ms after each new pattern was presented, the activity of neurons in Area A began to match that of the next pattern in the sequence. Error bars show the standard error of the mean match response.
