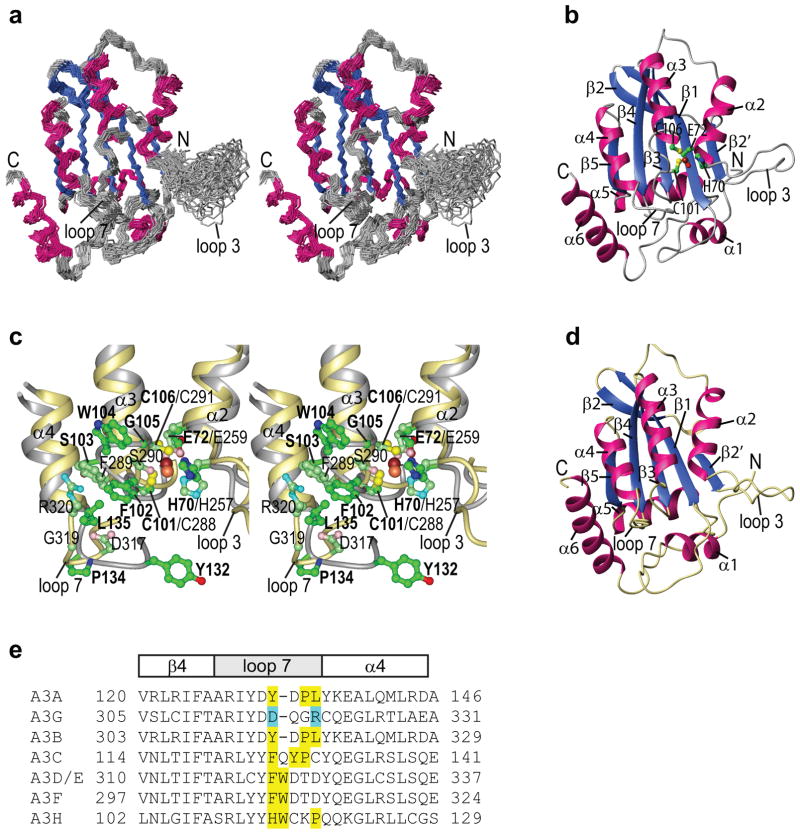
Figure 3. A3A NMR solution structure.
(a) Stereo-view of the final 30 conformer ensemble (N, Cα, C′). Regions of helical and beta sheet structures are colored hot pink and royal blue, respectively, and the remainder of the structure in grey. (b) Ribbon representation of the lowest energy structure of the ensemble, using the same color scheme as in (a). Secondary structure elements are labeled and the active site residues (H70, E72, C101, and C106) and the zinc ion are shown in ball and stick representation with carbon, nitrogen, oxygen, sulfur, and zinc atoms in green, blue, red, yellow, and brown, respectively. (c) Stereo-view of the superimposition of the active site regions of the current A3A NMR and the A3G-CTD (PDB: 3IR2) X-ray structures. The backbone traces of A3A and A3G-CTD are colored grey and khaki, respectively. Side chains are shown in ball-and-stick representation with carbon, nitrogen, oxygen, sulfur and zinc atoms of A3A and A3G in green, blue, red, yellow and brown, and pale green, cyan, pink, yellow and orange, respectively. A3A residues are labeled in bold. (d) Ribbon representation of the A3G-CTD (A3G191-384-2K3A, PDB: 3IR2) X-ray structure35. (e) Amino acid sequences of the loop 7 region in different A3 proteins. Large, hydrophobic residues are highlighted in yellow and the polar residues D317 and R320 in A3G are highlighted in cyan.

