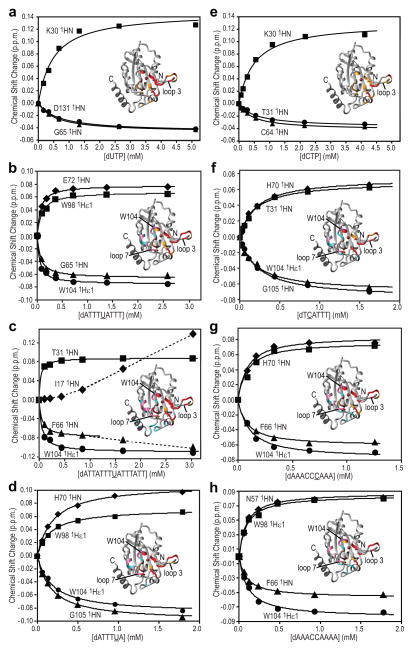
Figure 4. Binding of A3A to mononucleotides and ssDNAs.
Titration curves for representative HN resonances and binding site mapping (inset) for binding of dUTP (a), ATTTUATTT (b), ATTATTTUATTTATT (c), ATTTUA (d), dCTP (e), TCATTT (f), AAACCCAAA (g) and AAACCAAAA (h). A3A residues whose resonances exhibit large 1H,15N-combined chemical shift changes upon nucleotide addition are colored red (>0.05 p.p.m.) and orange (0.028–0.050 p.p.m.). Those only affected by ssDNA binding, but not dCTP/dUTP, are shown in dark pink (>0.050 p.p.m) and cyan (0.028–0.050 p.p.m.). All 1H-15N HSQC spectra were recorded at 25°C using 25 mM sodium phosphate buffer, pH 6.9. 1H,15N-combined chemical shift changes were calculated using , ΔδHN and ΔδN comprising 1HN 15N chemical shift differences observed for A3A before and after adding ligands (~90% saturation).

