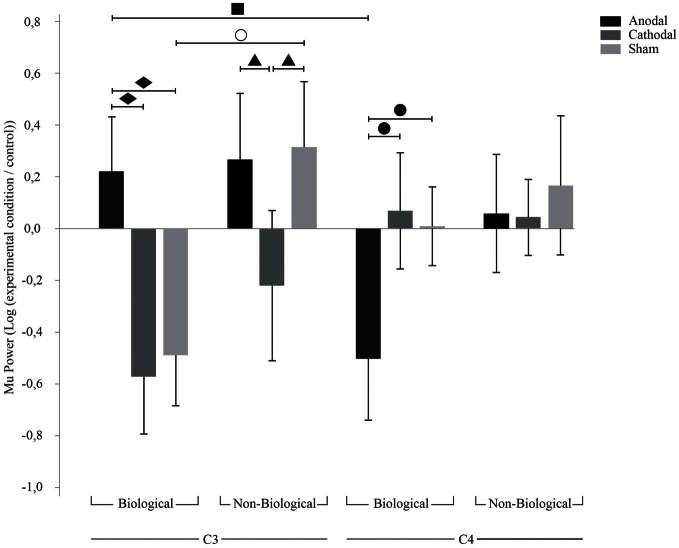
Figure 2.
TDCS effects on C3 and C4. Bars mean standard errors. ○, sham tDCS resulted in opposing effects for biological and non-biological conditions at C3 (p = 0.005); ■, anodal tDCS resulted in ERS at C3 and ERD at C4 (p = 0.01); ▲, cathodal tDCS resulted in Mu ERD compared to anodal (p = 0.03) and sham (p = 0.02) tDCS at C3 during non-biological movement; ●, anodal tDCS resulted in Mu ERD when compared to cathodal (p = 0.01) and sham (p = 0.02) tDCS at C4 during biological movement; ♦, anodal tDCS resulted in Mu ERS when compared to cathodal (p = 0.001) and sham (p = 0.002) tDCS at C3 during biological movement.

