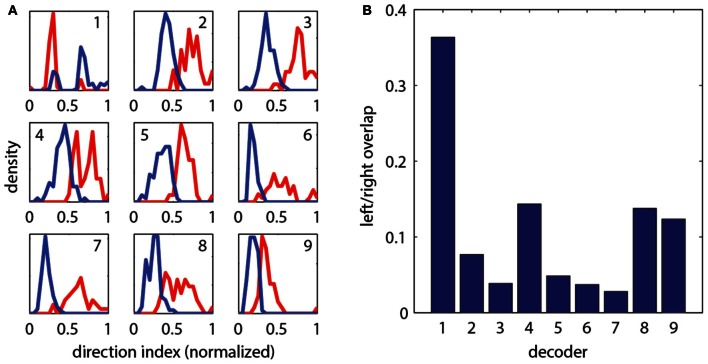
Figure 2.
Evaluation of different strategies for decoding fictive turn direction. (A) Histograms of normalized direction index of nine different decoders, over 127 total swim bouts (one representative fish). Left and right moving gratings were presented to paralyzed fish while their fictive responses were recorded. Nine different decoders each produced different sets of direction indices (red: responses to right, blue: responses to left). Decoding strategies were (“bumps” refers to the oscillations visible in the fictive swim bouts, as in Figure 1): (1) Ratio of width of first left and right bumps of the processed fictive signal, (2) Ratio of heights of the first bumps, (3) Ratio of the left and right power of the entire swim bout, (4) Ratio of the areas of the first bump of the left and right swim bout, (5) Difference in the widths of the first bumps, (6) Difference in the heights of the first bumps, (7) Difference in left and right power of the entire swim bout, (8) Difference in the areas of the first bumps, (9) Difference in the rise time (time to peak) of the first bumps. It can be seen that each decoder produces segregation between the responses to the left and right moving visual stimuli, but some cause more segregation than others. (B) Quantification of overlap in direction index of the nine decoders (lower value indicates better performance). Decoder (7), the difference in power between the left and right channels over the entire swim bout, performs the best.

