Figure 3.
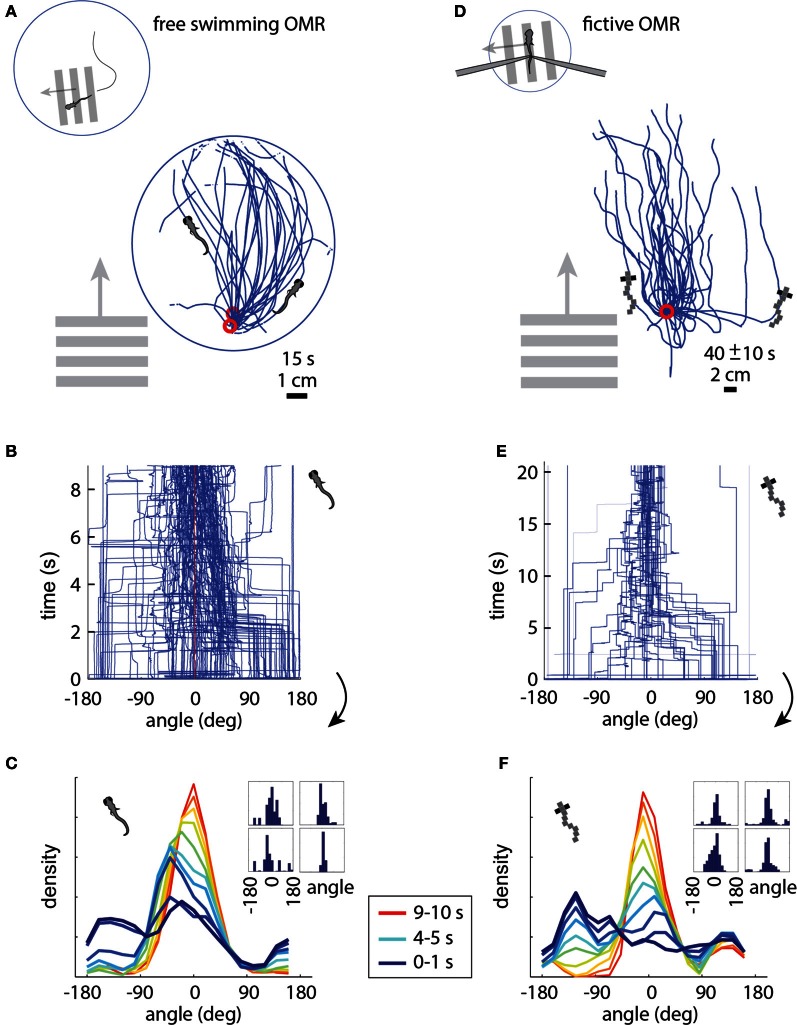
The optomotor response in free (A–C) and paralyzed (D–F) fish. (A) Swim trajectories during visual whole-field motion projected at the bottom of a 10 cm petri dish (N = 3 example fish). Grating period was 1 cm, speed 1 cm/s. Data have been rotated so that the starting point is near the bottom of the dish, as seen from above. (B) Heading angle over time for N = 6 freely swimming fish. The time axis is cut off at 9 s, because at that time a number of fish reached the end of the petri dish and the heading angle became ill-defined. (C) Changing heading direction over time; same data as (B). Dark blue: histogram at start of trials (N = 6 fish, 10 trials each). Red: histogram 10 s after trial onset. Each color represents one second of data. Inset: Histograms of heading angle, centered at zero degrees, which is the direction of motion (4 representative fish). (D) Fictive swim trajectories in the virtual reality version of the OMR. Like freely swimming fish, the paralyzed fish turn in the direction of motion and swim along with it (N = 6 fish). (E) Heading direction over time for N = 6 paralyzed fish. Note that the time axis is different from (B) (because distance in the virtual environment was not limited by a petri dish), but the dynamics are similar (see panels C and F). (F) Changing heading direction over time (N = 6 fish; same data as E). Colors as in (C). The time course of heading angle change is similar to the freely swimming case shown in C. Inset: Angle histograms of four representative fish over the entire experiment.

