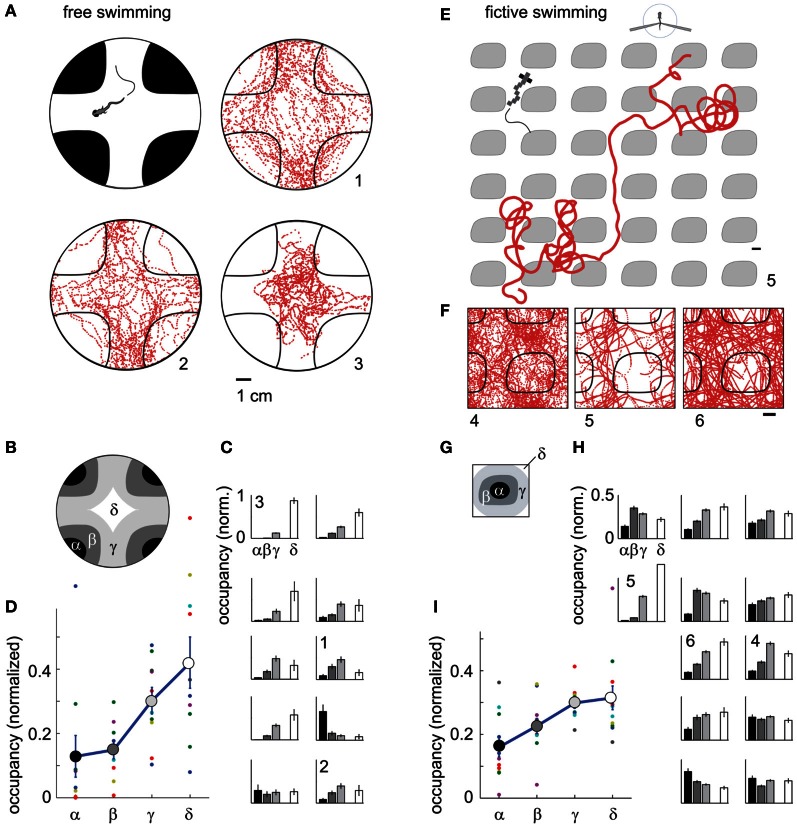
Figure 6.
Darkness avoidance in free and paralyzed fish. (A) Top view schematic of the arena, consisting of a 10 cm petri dish on top of a visual display. Display color was red to replicate the color used during two-photon imaging. Shown are trajectories of 3 fish over 20 min of experimental time (labeled 1–3). On average, fish spend more time in the bright region. (B) Subdivisions α − δ of the arena used for further analysis of location preference. (C) Time spent in the areas α − δ (N = 10 fish). Eight fish preferentially stay in the bright region; one fish spends more time in the dark region; one fish does not distinguish. Error bars computed from Bernoulli distribution over counts, then normalized to the area of the four regions. (D) Average normalized occupancy of regions α − δ (N = 10 fish) shows a strong and graded bias toward staying in the bright regions. (E) Example trajectory of paralyzed fish through the virtual environment. Scale bar, 1 cm. (F) Complete trajectories of three fish over all tiles of the virtual environment, shown in relation to a single tile and parts of neighboring tiles. (G) Subdivisions of one tile, with α and β the center and boundary of a dark tile, and δ and δ inner and outer areas of the bright space, as in (B). (H) Occupancy over areas α − δ of all tiles in the virtual environment (N = 12 paralyzed fish). Most fish spend less time in the dark. Some also avoid the center of the white areas (δ), such as fish 4. (I) Average normalized occupancy of bright to dark regions α − δ of the virtual environment shows graded preference to bright areas. Differences in occupancy are smaller than in freely swimming fish (D).

